29
/it/
it
AIzaSyAYiBZKx7MnpbEhh9jyipgxe19OcubqV5w
April 1, 2024
34532
Fragile and conflict affected situations
FCS
false
2
1
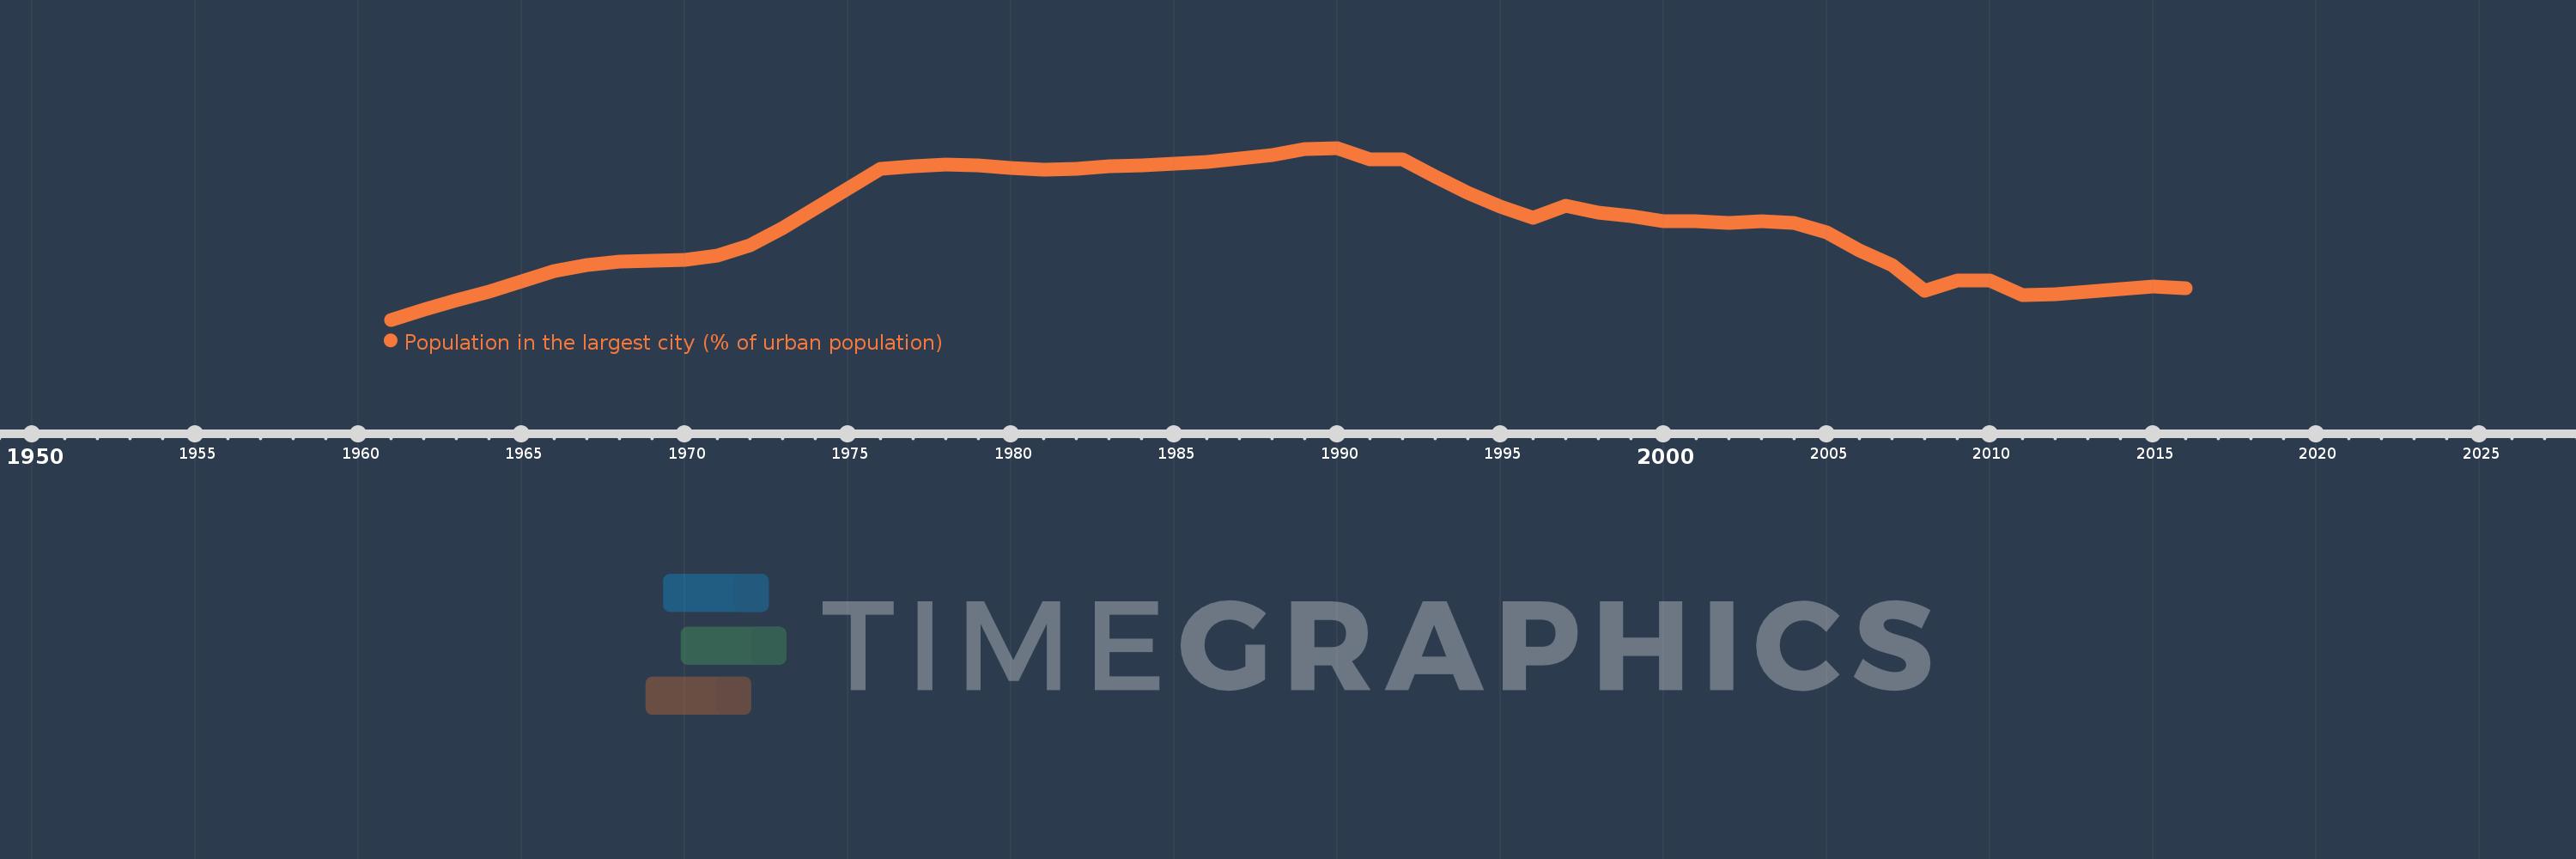
Population in the largest city (% of urban population)
2016,2015,2014,2013,2012,2011,2010,2009,2008,2007,2006,2005,2004,2003,2002,2001,2000,1999,1998,1997,1996,1995,1994,1993,1992,1991,1990,1989,1988,1987,1986,1985,1984,1983,1982,1981,1980,1979,1978,1977,1976,1975,1974,1973,1972,1971,1970,1969,1968,1967,1966,1965,1964,1963,1962,1961
Queste statistiche in altri paesi:
AfghanistanAlbaniaAlgeriaAngolaArab WorldArgentinaArmeniaAustraliaAustriaAzerbaijanBahrainBangladeshBelarusBelgiumBeninBoliviaBosnia and HerzegovinaBrazilBulgariaBurkina FasoBurundiCambodiaCameroonCanadaCentral African RepublicCentral Europe and the BalticsChadChileChinaColombiaCongo, Dem. Rep.Congo, Rep.Costa RicaCote d'IvoireCroatiaCubaCzech RepublicDenmarkDjiboutiDominican RepublicEarly-demographic dividendEast Asia & PacificEast Asia & Pacific (excluding high income)East Asia & Pacific (IDA & IBRD countries)EcuadorEgypt, Arab Rep.El SalvadorEritreaEstoniaEthiopiaEuro areaEurope & Central AsiaEurope & Central Asia (excluding high income)Europe & Central Asia (IDA & IBRD countries)European UnionFinlandFragile and conflict affected situationsFranceGabonGambia, TheGeorgiaGermanyGhanaGreeceGuatemalaGuineaGuinea-BissauHaitiHeavily indebted poor countries (HIPC)High incomeHondurasHong Kong SAR, ChinaHungaryIBRD onlyIDA & IBRD totalIDA blendIDA onlyIDA totalIndiaIndonesiaIran, Islamic Rep.IraqIrelandIsraelItalyJamaicaJapanJordanKazakhstanKenyaKorea, Dem. People’s Rep.Korea, Rep.KuwaitKyrgyz RepublicLao PDRLate-demographic dividendLatin America & Caribbean Latin America & Caribbean (excluding high income)Latin America & the Caribbean (IDA & IBRD countries)LatviaLeast developed countries: UN classificationLebanonLiberiaLibyaLithuaniaLow & middle incomeLow incomeLower middle incomeMacao SAR, ChinaMacedonia, FYRMadagascarMalawiMalaysiaMaliMauritaniaMexicoMiddle East & North AfricaMiddle East & North Africa (excluding high income)Middle East & North Africa (IDA & IBRD countries)Middle incomeMoldovaMongoliaMoroccoMozambiqueMyanmarNamibiaNepalNetherlandsNew ZealandNicaraguaNigerNigeriaNorth AmericaNorwayOECD membersOmanPakistanPanamaPapua New GuineaParaguayPeruPhilippinesPolandPortugalPost-demographic dividendPre-demographic dividendPuerto RicoQatarRomaniaRussian FederationRwandaSaudi ArabiaSenegalSerbiaSierra LeoneSingaporeSlovak RepublicSomaliaSouth AfricaSouth AsiaSouth Asia (IDA & IBRD)South SudanSpainSri LankaSub-Saharan Africa Sub-Saharan Africa (excluding high income)Sub-Saharan Africa (IDA & IBRD countries)SudanSwedenSwitzerlandSyrian Arab RepublicTajikistanTanzaniaThailandTogoTunisiaTurkeyTurkmenistanUgandaUkraineUnited Arab EmiratesUnited KingdomUnited StatesUpper middle incomeUruguayUzbekistanVenezuela, RBVietnamWest Bank and GazaWorldYemen, Rep.ZambiaZimbabwe Linea del tempo:
Questa scala temporale mostra un grafico dal 1961 anno al 2016 anno. Fragile and conflict affected situations. I dati fino ad 1960 anno non disponibili. Il numero di osservazioni attuali secondo i date: 56.
La fonte (nome):
Indicatori dello sviluppo mondiale
La fonte (organizzazione):
United Nations, World Urbanization Prospects.
Categorie:
Urban Development
sono stati aggiornati
23 apr 2017 anni
Indicatori delle variazioni dei valori per anni
Minima:
33.987
1 gen 1961 anni
Massimo:
37.919
1 gen 1990 anni
Alla data di osservazione
Valore
Variazione assoluta
La variazione rispetto al valore precedente
1 gen 1961 anni
33.987
+33.987
0.0%
1 gen 1962 anni
34.218
+0.231
0.68%
1 gen 1963 anni
34.443
+0.225
0.66%
1 gen 1964 anni
34.627
+0.184
0.53%
1 gen 1965 anni
34.875
+0.247
0.71%
1 gen 1966 anni
35.109
+0.235
0.67%
1 gen 1967 anni
35.238
+0.129
0.37%
1 gen 1968 anni
35.315
+0.077
0.22%
1 gen 1969 anni
35.333
+0.017
0.05%
1 gen 1970 anni
35.364
+0.032
0.09%
1 gen 1971 anni
35.449
+0.085
0.24%
1 gen 1972 anni
35.697
+0.248
0.7%
1 gen 1973 anni
36.076
+0.38
1.06%
1 gen 1974 anni
36.535
+0.458
1.27%
1 gen 1975 anni
36.997
+0.463
1.27%
1 gen 1976 anni
37.442
+0.445
1.2%
1 gen 1977 anni
37.505
+0.062
0.17%
1 gen 1978 anni
37.539
+0.034
0.09%
1 gen 1979 anni
37.519
-0.02
-0.05%
1 gen 1980 anni
37.468
-0.051
-0.14%
1 gen 1981 anni
37.428
-0.04
-0.11%
1 gen 1982 anni
37.443
+0.015
0.04%
1 gen 1983 anni
37.494
+0.052
0.14%
1 gen 1984 anni
37.514
+0.02
0.05%
1 gen 1985 anni
37.565
+0.051
0.13%
1 gen 1986 anni
37.608
+0.043
0.11%
1 gen 1987 anni
37.677
+0.07
0.19%
1 gen 1988 anni
37.761
+0.084
0.22%
1 gen 1989 anni
37.892
+0.131
0.35%
1 gen 1990 anni
37.919
+0.027
0.07%
1 gen 1991 anni
37.661
-0.258
-0.68%
1 gen 1992 anni
37.662
+0.001
0.0%
1 gen 1993 anni
37.255
-0.407
-1.08%
1 gen 1994 anni
36.889
-0.366
-0.98%
1 gen 1995 anni
36.57
-0.319
-0.86%
1 gen 1996 anni
36.325
-0.246
-0.67%
1 gen 1997 anni
36.595
+0.27
0.74%
1 gen 1998 anni
36.446
-0.149
-0.41%
1 gen 1999 anni
36.359
-0.087
-0.24%
1 gen 2000 anni
36.239
-0.12
-0.33%
1 gen 2001 anni
36.24
+0.0
0.0%
1 gen 2002 anni
36.205
-0.034
-0.09%
1 gen 2003 anni
36.243
+0.037
0.1%
1 gen 2004 anni
36.208
-0.035
-0.1%
1 gen 2005 anni
35.977
-0.231
-0.64%
1 gen 2006 anni
35.58
-0.397
-1.1%
1 gen 2007 anni
35.248
-0.332
-0.93%
1 gen 2008 anni
34.658
-0.591
-1.68%
1 gen 2009 anni
34.883
+0.225
0.65%
1 gen 2010 anni
34.895
+0.012
0.03%
1 gen 2011 anni
34.55
-0.345
-0.99%
1 gen 2012 anni
34.574
+0.025
0.07%
1 gen 2013 anni
34.621
+0.046
0.13%
1 gen 2014 anni
34.681
+0.06
0.17%
1 gen 2015 anni
34.744
+0.063
0.18%
1 gen 2016 anni
34.703
-0.041
-0.12%
Classificazione dei paesi secondo i statistiche attuali per anni


Commenti: