29
/it/
it
AIzaSyAYiBZKx7MnpbEhh9jyipgxe19OcubqV5w
April 1, 2024
27621
East Asia & Pacific
EAS
false
2
1
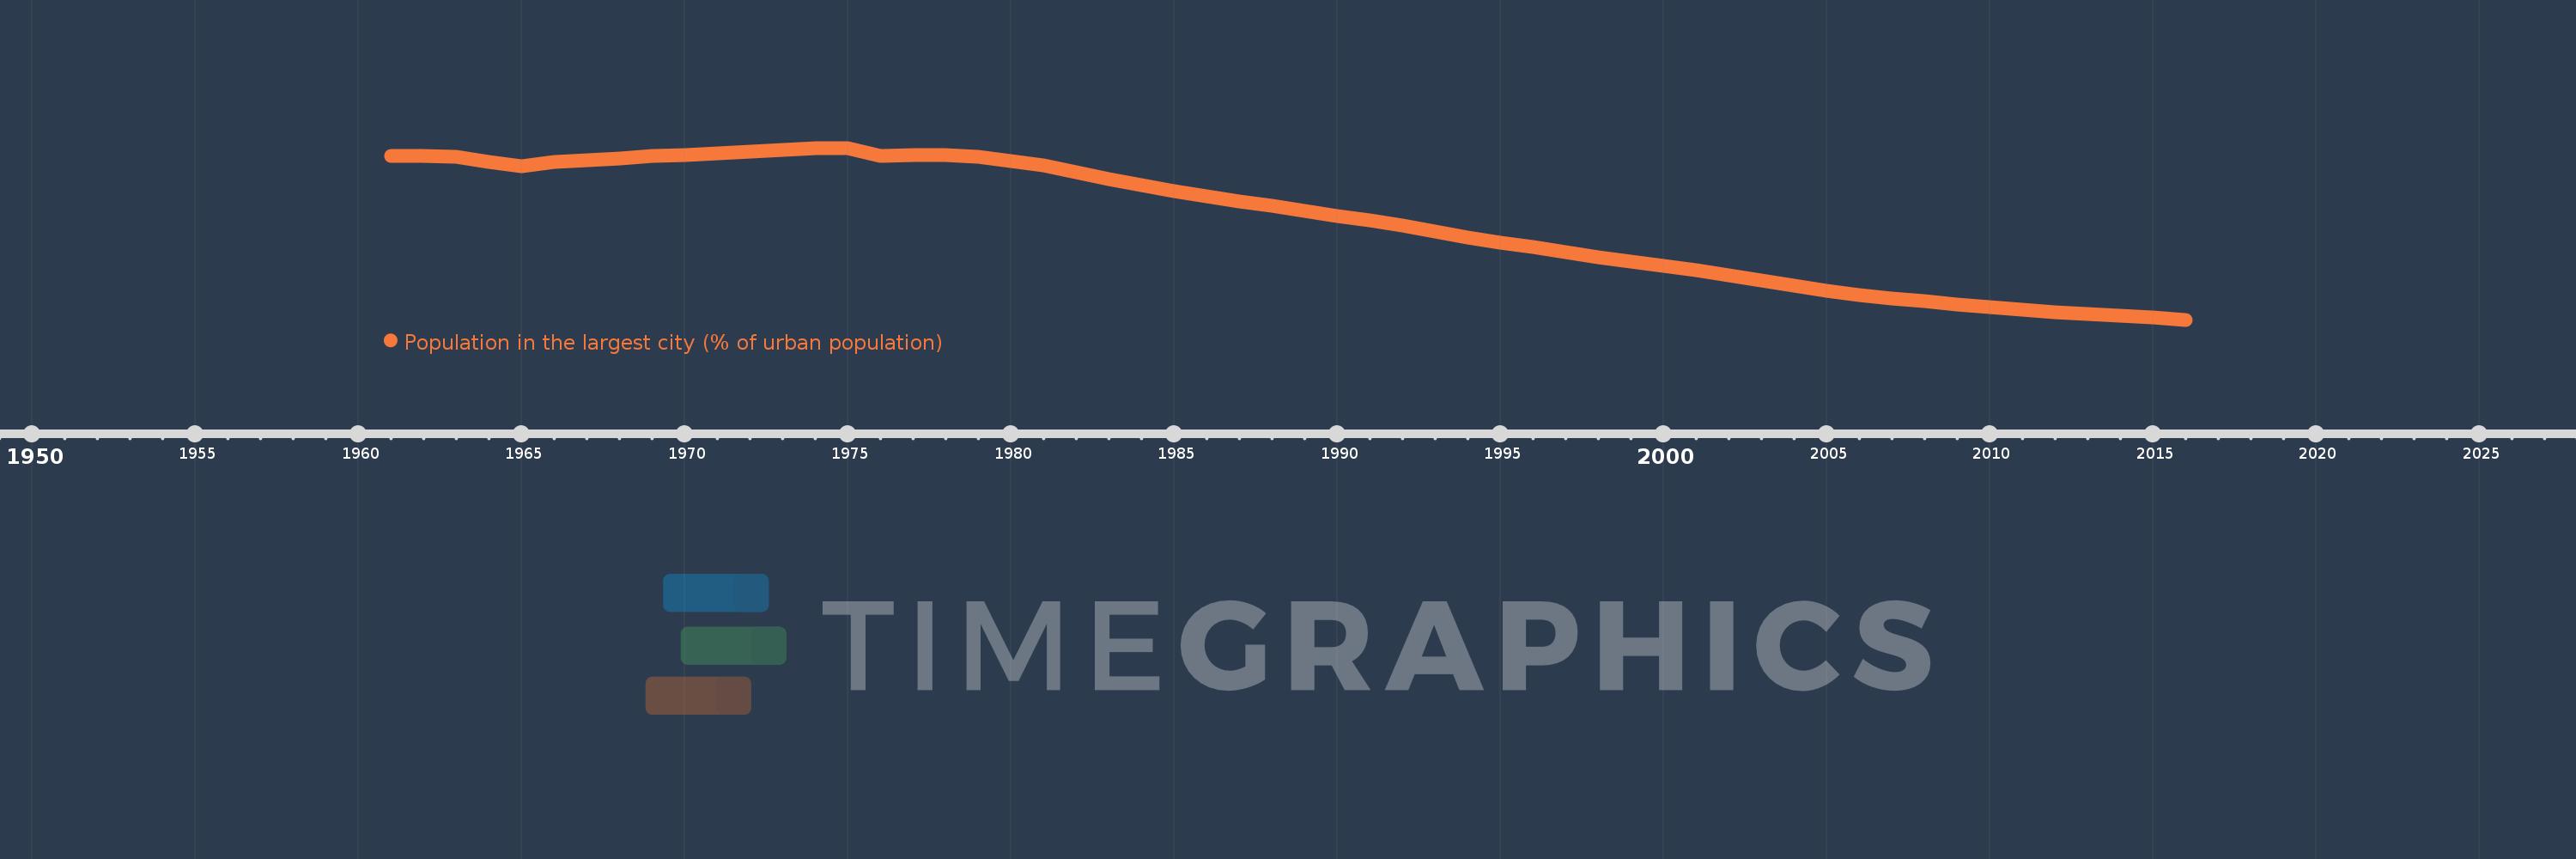
Population in the largest city (% of urban population)
2016,2015,2014,2013,2012,2011,2010,2009,2008,2007,2006,2005,2004,2003,2002,2001,2000,1999,1998,1997,1996,1995,1994,1993,1992,1991,1990,1989,1988,1987,1986,1985,1984,1983,1982,1981,1980,1979,1978,1977,1976,1975,1974,1973,1972,1971,1970,1969,1968,1967,1966,1965,1964,1963,1962,1961
Queste statistiche in altri paesi:
AfghanistanAlbaniaAlgeriaAngolaArab WorldArgentinaArmeniaAustraliaAustriaAzerbaijanBahrainBangladeshBelarusBelgiumBeninBoliviaBosnia and HerzegovinaBrazilBulgariaBurkina FasoBurundiCambodiaCameroonCanadaCentral African RepublicCentral Europe and the BalticsChadChileChinaColombiaCongo, Dem. Rep.Congo, Rep.Costa RicaCote d'IvoireCroatiaCubaCzech RepublicDenmarkDjiboutiDominican RepublicEarly-demographic dividendEast Asia & PacificEast Asia & Pacific (excluding high income)East Asia & Pacific (IDA & IBRD countries)EcuadorEgypt, Arab Rep.El SalvadorEritreaEstoniaEthiopiaEuro areaEurope & Central AsiaEurope & Central Asia (excluding high income)Europe & Central Asia (IDA & IBRD countries)European UnionFinlandFragile and conflict affected situationsFranceGabonGambia, TheGeorgiaGermanyGhanaGreeceGuatemalaGuineaGuinea-BissauHaitiHeavily indebted poor countries (HIPC)High incomeHondurasHong Kong SAR, ChinaHungaryIBRD onlyIDA & IBRD totalIDA blendIDA onlyIDA totalIndiaIndonesiaIran, Islamic Rep.IraqIrelandIsraelItalyJamaicaJapanJordanKazakhstanKenyaKorea, Dem. People’s Rep.Korea, Rep.KuwaitKyrgyz RepublicLao PDRLate-demographic dividendLatin America & Caribbean Latin America & Caribbean (excluding high income)Latin America & the Caribbean (IDA & IBRD countries)LatviaLeast developed countries: UN classificationLebanonLiberiaLibyaLithuaniaLow & middle incomeLow incomeLower middle incomeMacao SAR, ChinaMacedonia, FYRMadagascarMalawiMalaysiaMaliMauritaniaMexicoMiddle East & North AfricaMiddle East & North Africa (excluding high income)Middle East & North Africa (IDA & IBRD countries)Middle incomeMoldovaMongoliaMoroccoMozambiqueMyanmarNamibiaNepalNetherlandsNew ZealandNicaraguaNigerNigeriaNorth AmericaNorwayOECD membersOmanPakistanPanamaPapua New GuineaParaguayPeruPhilippinesPolandPortugalPost-demographic dividendPre-demographic dividendPuerto RicoQatarRomaniaRussian FederationRwandaSaudi ArabiaSenegalSerbiaSierra LeoneSingaporeSlovak RepublicSomaliaSouth AfricaSouth AsiaSouth Asia (IDA & IBRD)South SudanSpainSri LankaSub-Saharan Africa Sub-Saharan Africa (excluding high income)Sub-Saharan Africa (IDA & IBRD countries)SudanSwedenSwitzerlandSyrian Arab RepublicTajikistanTanzaniaThailandTogoTunisiaTurkeyTurkmenistanUgandaUkraineUnited Arab EmiratesUnited KingdomUnited StatesUpper middle incomeUruguayUzbekistanVenezuela, RBVietnamWest Bank and GazaWorldYemen, Rep.ZambiaZimbabwe Linea del tempo:
Questa scala temporale mostra un grafico dal 1961 anno al 2016 anno. East Asia & Pacific. I dati fino ad 1960 anno non disponibili. Il numero di osservazioni attuali secondo i date: 56.
La fonte (nome):
Indicatori dello sviluppo mondiale
La fonte (organizzazione):
United Nations, World Urbanization Prospects.
Categorie:
Urban Development
sono stati aggiornati
23 apr 2017 anni
Indicatori delle variazioni dei valori per anni
Minima:
11.73
1 gen 2016 anni
Massimo:
19.641
1 gen 1975 anni
Alla data di osservazione
Valore
Variazione assoluta
La variazione rispetto al valore precedente
1 gen 1961 anni
19.272
+19.272
0.0%
1 gen 1962 anni
19.284
+0.012
0.06%
1 gen 1963 anni
19.217
-0.067
-0.35%
1 gen 1964 anni
18.999
-0.218
-1.14%
1 gen 1965 anni
18.792
-0.206
-1.09%
1 gen 1966 anni
18.997
+0.205
1.09%
1 gen 1967 anni
19.06
+0.063
0.33%
1 gen 1968 anni
19.15
+0.089
0.47%
1 gen 1969 anni
19.268
+0.118
0.62%
1 gen 1970 anni
19.298
+0.03
0.16%
1 gen 1971 anni
19.396
+0.098
0.51%
1 gen 1972 anni
19.468
+0.072
0.37%
1 gen 1973 anni
19.542
+0.074
0.38%
1 gen 1974 anni
19.622
+0.08
0.41%
1 gen 1975 anni
19.641
+0.018
0.09%
1 gen 1976 anni
19.28
-0.361
-1.84%
1 gen 1977 anni
19.302
+0.023
0.12%
1 gen 1978 anni
19.306
+0.004
0.02%
1 gen 1979 anni
19.227
-0.079
-0.41%
1 gen 1980 anni
19.039
-0.188
-0.98%
1 gen 1981 anni
18.839
-0.2
-1.05%
1 gen 1982 anni
18.541
-0.299
-1.58%
1 gen 1983 anni
18.195
-0.346
-1.87%
1 gen 1984 anni
17.922
-0.272
-1.5%
1 gen 1985 anni
17.671
-0.251
-1.4%
1 gen 1986 anni
17.425
-0.246
-1.39%
1 gen 1987 anni
17.188
-0.237
-1.36%
1 gen 1988 anni
16.965
-0.223
-1.29%
1 gen 1989 anni
16.739
-0.227
-1.34%
1 gen 1990 anni
16.523
-0.215
-1.29%
1 gen 1991 anni
16.325
-0.198
-1.2%
1 gen 1992 anni
16.065
-0.26
-1.59%
1 gen 1993 anni
15.787
-0.279
-1.73%
1 gen 1994 anni
15.534
-0.253
-1.6%
1 gen 1995 anni
15.296
-0.237
-1.53%
1 gen 1996 anni
15.066
-0.231
-1.51%
1 gen 1997 anni
14.826
-0.24
-1.59%
1 gen 1998 anni
14.606
-0.22
-1.49%
1 gen 1999 anni
14.395
-0.211
-1.45%
1 gen 2000 anni
14.193
-0.202
-1.4%
1 gen 2001 anni
14.009
-0.184
-1.3%
1 gen 2002 anni
13.781
-0.228
-1.62%
1 gen 2003 anni
13.534
-0.247
-1.79%
1 gen 2004 anni
13.288
-0.246
-1.82%
1 gen 2005 anni
13.076
-0.212
-1.6%
1 gen 2006 anni
12.882
-0.194
-1.49%
1 gen 2007 anni
12.715
-0.166
-1.29%
1 gen 2008 anni
12.573
-0.142
-1.11%
1 gen 2009 anni
12.442
-0.131
-1.04%
1 gen 2010 anni
12.311
-0.132
-1.06%
1 gen 2011 anni
12.191
-0.12
-0.97%
1 gen 2012 anni
12.08
-0.111
-0.91%
1 gen 2013 anni
11.985
-0.095
-0.79%
1 gen 2014 anni
11.897
-0.088
-0.73%
1 gen 2015 anni
11.82
-0.077
-0.65%
1 gen 2016 anni
11.73
-0.09
-0.76%
Classificazione dei paesi secondo i statistiche attuali per anni


Commenti: