29
/it/
it
AIzaSyAYiBZKx7MnpbEhh9jyipgxe19OcubqV5w
April 1, 2024
54480
Pacific island small states
PSS
false
2
1
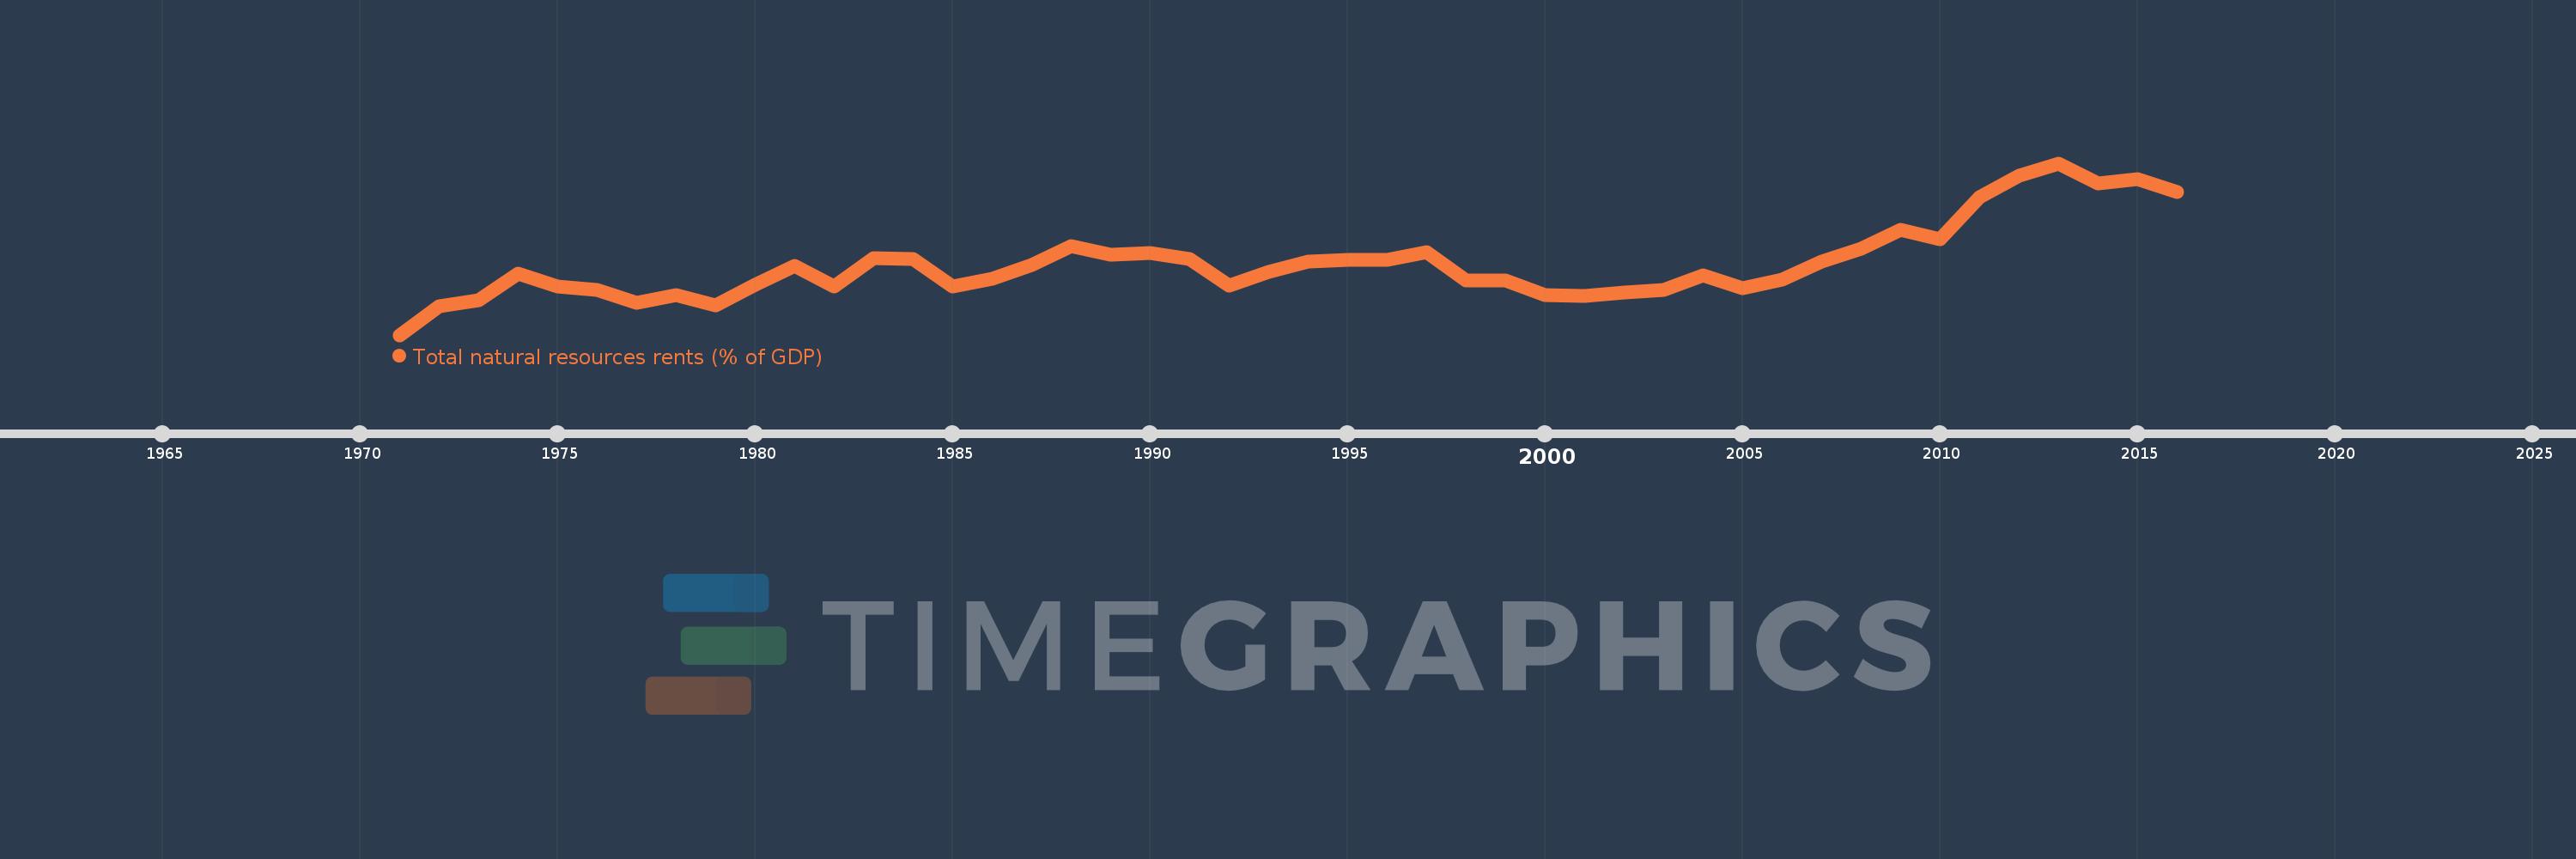
Total natural resources rents (% of GDP)
2016,2015,2014,2013,2012,2011,2010,2009,2008,2007,2006,2005,2004,2003,2002,2001,2000,1999,1998,1997,1996,1995,1994,1993,1992,1991,1990,1989,1988,1987,1986,1985,1984,1983,1982,1981,1980,1979,1978,1977,1976,1975,1974,1973,1972,1971
Queste statistiche in altri paesi:
AfghanistanAlbaniaAlgeriaAngolaArab WorldArgentinaArmeniaArubaAustraliaAustriaAzerbaijanBahamas, TheBahrainBangladeshBarbadosBelarusBelgiumBelizeBeninBhutanBoliviaBosnia and HerzegovinaBotswanaBrazilBrunei DarussalamBulgariaBurkina FasoBurundiCabo VerdeCambodiaCameroonCanadaCaribbean small statesCentral African RepublicCentral Europe and the BalticsChadChileChinaColombiaComorosCongo, Dem. Rep.Congo, Rep.Costa RicaCote d'IvoireCroatiaCubaCyprusCzech RepublicDenmarkDjiboutiDominicaDominican RepublicEarly-demographic dividendEast Asia & PacificEast Asia & Pacific (excluding high income)East Asia & Pacific (IDA & IBRD countries)EcuadorEgypt, Arab Rep.El SalvadorEquatorial GuineaEritreaEstoniaEthiopiaEuro areaEurope & Central AsiaEurope & Central Asia (excluding high income)Europe & Central Asia (IDA & IBRD countries)European UnionFijiFinlandFragile and conflict affected situationsFranceFrench PolynesiaGabonGambia, TheGeorgiaGermanyGhanaGreeceGuatemalaGuineaGuinea-BissauGuyanaHaitiHeavily indebted poor countries (HIPC)High incomeHondurasHong Kong SAR, ChinaHungaryIBRD onlyIcelandIDA & IBRD totalIDA blendIDA onlyIDA totalIndiaIndonesiaIran, Islamic Rep.IraqIrelandIsraelItalyJamaicaJapanJordanKazakhstanKenyaKiribatiKorea, Rep.KuwaitKyrgyz RepublicLao PDRLate-demographic dividendLatin America & Caribbean Latin America & Caribbean (excluding high income)Latin America & the Caribbean (IDA & IBRD countries)LatviaLeast developed countries: UN classificationLebanonLesothoLiberiaLibyaLithuaniaLow & middle incomeLow incomeLower middle incomeLuxembourgMacao SAR, ChinaMacedonia, FYRMadagascarMalawiMalaysiaMaldivesMaliMaltaMauritaniaMauritiusMexicoMiddle East & North AfricaMiddle East & North Africa (excluding high income)Middle East & North Africa (IDA & IBRD countries)Middle incomeMoldovaMongoliaMontenegroMoroccoMozambiqueMyanmarNamibiaNepalNetherlandsNew CaledoniaNew ZealandNicaraguaNigerNigeriaNorth AmericaNorwayOECD membersOmanOther small statesPacific island small statesPakistanPanamaPapua New GuineaParaguayPeruPhilippinesPolandPortugalPost-demographic dividendPre-demographic dividendQatarRomaniaRussian FederationRwandaSamoaSao Tome and PrincipeSaudi ArabiaSenegalSerbiaSeychellesSierra LeoneSingaporeSlovak RepublicSloveniaSmall statesSolomon IslandsSouth AfricaSouth AsiaSouth Asia (IDA & IBRD)South SudanSpainSri LankaSt. LuciaSt. Vincent and the GrenadinesSub-Saharan Africa Sub-Saharan Africa (excluding high income)Sub-Saharan Africa (IDA & IBRD countries)SudanSurinameSwazilandSwedenSwitzerlandSyrian Arab RepublicTajikistanTanzaniaThailandTimor-LesteTogoTongaTrinidad and TobagoTunisiaTurkeyTurkmenistanUgandaUkraineUnited Arab EmiratesUnited KingdomUnited StatesUpper middle incomeUruguayUzbekistanVanuatuVenezuela, RBVietnamWorldYemen, Rep.ZambiaZimbabwe Linea del tempo:
Questa scala temporale mostra un grafico dal 1971 anno al 2016 anno. Pacific island small states. I dati fino ad 1970 anno non disponibili. Il numero di osservazioni attuali secondo i date: 46.
La fonte (nome):
Indicatori dello sviluppo mondiale
La fonte (organizzazione):
Estimates based on sources and methods described in "The Changing Wealth of Nations: Measuring Sustainable Development in the New Millennium" (World Bank, 2011).
Categorie:
Energy & Mining, Environment
sono stati aggiornati
23 apr 2017 anni
Indicatori delle variazioni dei valori per anni
Minima:
0.322
1 gen 1971 anni
Massimo:
4.929
1 gen 2013 anni
Alla data di osservazione
Valore
Variazione assoluta
La variazione rispetto al valore precedente
1 gen 1971 anni
0.322
+0.322
0.0%
1 gen 1972 anni
1.092
+0.77
239.53%
1 gen 1973 anni
1.25
+0.158
14.5%
1 gen 1974 anni
1.978
+0.727
58.18%
1 gen 1975 anni
1.63
-0.347
-17.57%
1 gen 1976 anni
1.537
-0.093
-5.72%
1 gen 1977 anni
1.176
-0.361
-23.46%
1 gen 1978 anni
1.39
+0.214
18.19%
1 gen 1979 anni
1.12
-0.27
-19.42%
1 gen 1980 anni
1.664
+0.543
48.51%
1 gen 1981 anni
2.172
+0.508
30.55%
1 gen 1982 anni
1.634
-0.538
-24.78%
1 gen 1983 anni
2.394
+0.761
46.56%
1 gen 1984 anni
2.363
-0.031
-1.3%
1 gen 1985 anni
1.625
-0.738
-31.24%
1 gen 1986 anni
1.834
+0.208
12.82%
1 gen 1987 anni
2.207
+0.373
20.34%
1 gen 1988 anni
2.714
+0.508
23.01%
1 gen 1989 anni
2.481
-0.233
-8.58%
1 gen 1990 anni
2.512
+0.03
1.21%
1 gen 1991 anni
2.372
-0.139
-5.54%
1 gen 1992 anni
1.644
-0.728
-30.69%
1 gen 1993 anni
2.007
+0.363
22.07%
1 gen 1994 anni
2.296
+0.289
14.4%
1 gen 1995 anni
2.334
+0.038
1.65%
1 gen 1996 anni
2.349
+0.015
0.65%
1 gen 1997 anni
2.551
+0.202
8.6%
1 gen 1998 anni
1.791
-0.76
-29.77%
1 gen 1999 anni
1.777
-0.015
-0.81%
1 gen 2000 anni
1.39
-0.387
-21.78%
1 gen 2001 anni
1.376
-0.014
-1.0%
1 gen 2002 anni
1.458
+0.082
5.94%
1 gen 2003 anni
1.532
+0.075
5.11%
1 gen 2004 anni
1.913
+0.381
24.86%
1 gen 2005 anni
1.569
-0.344
-18.0%
1 gen 2006 anni
1.797
+0.228
14.53%
1 gen 2007 anni
2.302
+0.505
28.12%
1 gen 2008 anni
2.634
+0.332
14.41%
1 gen 2009 anni
3.138
+0.504
19.15%
1 gen 2010 anni
2.882
-0.256
-8.17%
1 gen 2011 anni
4.013
+1.131
39.25%
1 gen 2012 anni
4.606
+0.593
14.77%
1 gen 2013 anni
4.929
+0.324
7.03%
1 gen 2014 anni
4.38
-0.549
-11.13%
1 gen 2015 anni
4.51
+0.13
2.96%
1 gen 2016 anni
4.159
-0.351
-7.78%
Classificazione dei paesi secondo i statistiche attuali per anni


Commenti: