29
/it/
it
AIzaSyAYiBZKx7MnpbEhh9jyipgxe19OcubqV5w
April 1, 2024
101666
Canada
CAN
true
2
1
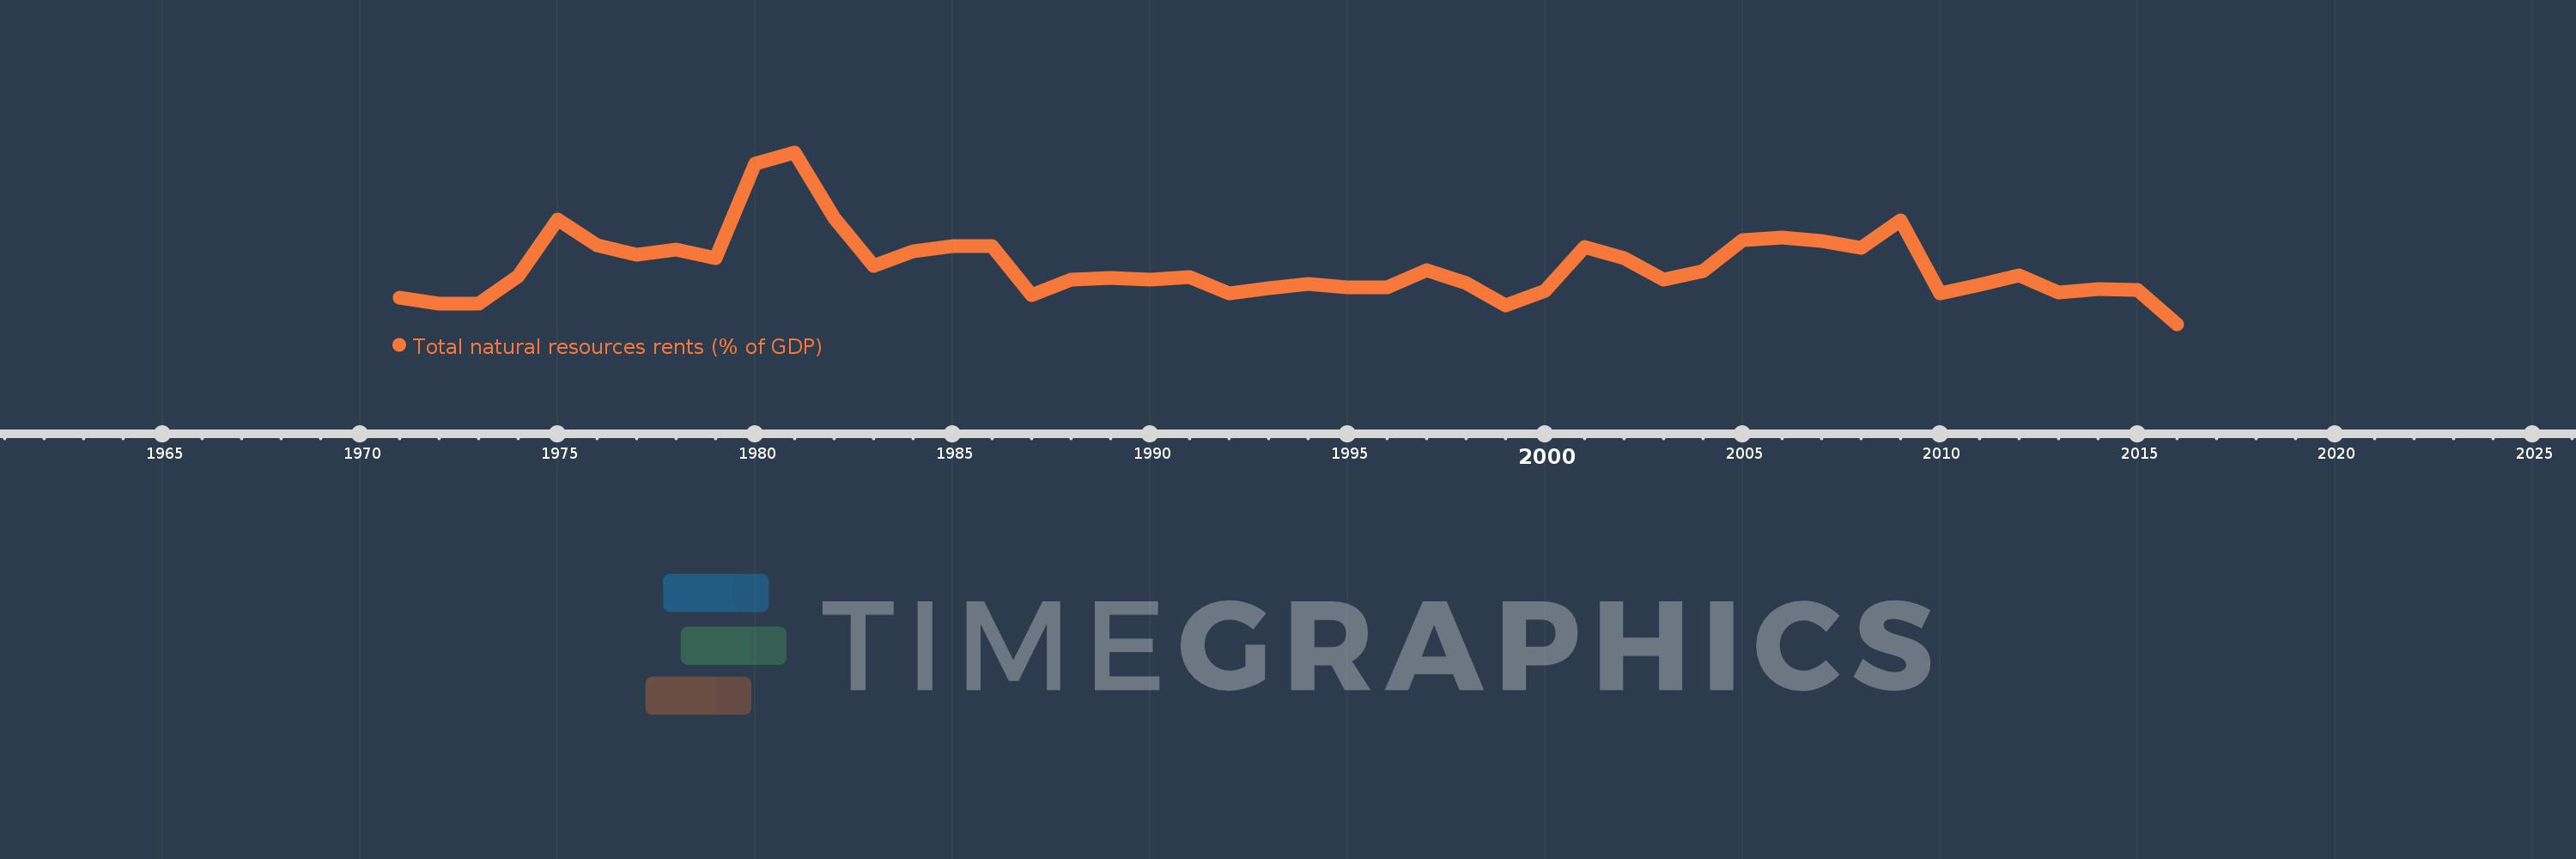
Total natural resources rents (% of GDP)
2016,2015,2014,2013,2012,2011,2010,2009,2008,2007,2006,2005,2004,2003,2002,2001,2000,1999,1998,1997,1996,1995,1994,1993,1992,1991,1990,1989,1988,1987,1986,1985,1984,1983,1982,1981,1980,1979,1978,1977,1976,1975,1974,1973,1972,1971
Queste statistiche in altri paesi:
AfghanistanAlbaniaAlgeriaAngolaArab WorldArgentinaArmeniaArubaAustraliaAustriaAzerbaijanBahamas, TheBahrainBangladeshBarbadosBelarusBelgiumBelizeBeninBhutanBoliviaBosnia and HerzegovinaBotswanaBrazilBrunei DarussalamBulgariaBurkina FasoBurundiCabo VerdeCambodiaCameroonCanadaCaribbean small statesCentral African RepublicCentral Europe and the BalticsChadChileChinaColombiaComorosCongo, Dem. Rep.Congo, Rep.Costa RicaCote d'IvoireCroatiaCubaCyprusCzech RepublicDenmarkDjiboutiDominicaDominican RepublicEarly-demographic dividendEast Asia & PacificEast Asia & Pacific (excluding high income)East Asia & Pacific (IDA & IBRD countries)EcuadorEgypt, Arab Rep.El SalvadorEquatorial GuineaEritreaEstoniaEthiopiaEuro areaEurope & Central AsiaEurope & Central Asia (excluding high income)Europe & Central Asia (IDA & IBRD countries)European UnionFijiFinlandFragile and conflict affected situationsFranceFrench PolynesiaGabonGambia, TheGeorgiaGermanyGhanaGreeceGuatemalaGuineaGuinea-BissauGuyanaHaitiHeavily indebted poor countries (HIPC)High incomeHondurasHong Kong SAR, ChinaHungaryIBRD onlyIcelandIDA & IBRD totalIDA blendIDA onlyIDA totalIndiaIndonesiaIran, Islamic Rep.IraqIrelandIsraelItalyJamaicaJapanJordanKazakhstanKenyaKiribatiKorea, Rep.KuwaitKyrgyz RepublicLao PDRLate-demographic dividendLatin America & Caribbean Latin America & Caribbean (excluding high income)Latin America & the Caribbean (IDA & IBRD countries)LatviaLeast developed countries: UN classificationLebanonLesothoLiberiaLibyaLithuaniaLow & middle incomeLow incomeLower middle incomeLuxembourgMacao SAR, ChinaMacedonia, FYRMadagascarMalawiMalaysiaMaldivesMaliMaltaMauritaniaMauritiusMexicoMiddle East & North AfricaMiddle East & North Africa (excluding high income)Middle East & North Africa (IDA & IBRD countries)Middle incomeMoldovaMongoliaMontenegroMoroccoMozambiqueMyanmarNamibiaNepalNetherlandsNew CaledoniaNew ZealandNicaraguaNigerNigeriaNorth AmericaNorwayOECD membersOmanOther small statesPacific island small statesPakistanPanamaPapua New GuineaParaguayPeruPhilippinesPolandPortugalPost-demographic dividendPre-demographic dividendQatarRomaniaRussian FederationRwandaSamoaSao Tome and PrincipeSaudi ArabiaSenegalSerbiaSeychellesSierra LeoneSingaporeSlovak RepublicSloveniaSmall statesSolomon IslandsSouth AfricaSouth AsiaSouth Asia (IDA & IBRD)South SudanSpainSri LankaSt. LuciaSt. Vincent and the GrenadinesSub-Saharan Africa Sub-Saharan Africa (excluding high income)Sub-Saharan Africa (IDA & IBRD countries)SudanSurinameSwazilandSwedenSwitzerlandSyrian Arab RepublicTajikistanTanzaniaThailandTimor-LesteTogoTongaTrinidad and TobagoTunisiaTurkeyTurkmenistanUgandaUkraineUnited Arab EmiratesUnited KingdomUnited StatesUpper middle incomeUruguayUzbekistanVanuatuVenezuela, RBVietnamWorldYemen, Rep.ZambiaZimbabwe Linea del tempo:
Questa scala temporale mostra un grafico dal 1971 anno al 2016 anno. Canada. I dati fino ad 1970 anno non disponibili. Il numero di osservazioni attuali secondo i date: 46.
La fonte (nome):
Indicatori dello sviluppo mondiale
La fonte (organizzazione):
Estimates based on sources and methods described in "The Changing Wealth of Nations: Measuring Sustainable Development in the New Millennium" (World Bank, 2011).
Categorie:
Energy & Mining, Environment
sono stati aggiornati
23 apr 2017 anni
Indicatori delle variazioni dei valori per anni
Minima:
0.889
1 gen 2016 anni
Massimo:
9.013
1 gen 1981 anni
Alla data di osservazione
Valore
Variazione assoluta
La variazione rispetto al valore precedente
1 gen 1971 anni
2.129
+2.129
0.0%
1 gen 1972 anni
1.841
-0.289
-13.55%
1 gen 1973 anni
1.867
+0.027
1.44%
1 gen 1974 anni
3.142
+1.275
68.29%
1 gen 1975 anni
5.824
+2.682
85.34%
1 gen 1976 anni
4.64
-1.185
-20.34%
1 gen 1977 anni
4.18
-0.459
-9.9%
1 gen 1978 anni
4.423
+0.243
5.8%
1 gen 1979 anni
4.02
-0.402
-9.1%
1 gen 1980 anni
8.482
+4.461
110.96%
1 gen 1981 anni
9.013
+0.531
6.27%
1 gen 1982 anni
5.942
-3.071
-34.07%
1 gen 1983 anni
3.66
-2.282
-38.41%
1 gen 1984 anni
4.343
+0.684
18.69%
1 gen 1985 anni
4.573
+0.23
5.28%
1 gen 1986 anni
4.587
+0.014
0.31%
1 gen 1987 anni
2.264
-2.323
-50.64%
1 gen 1988 anni
2.99
+0.726
32.07%
1 gen 1989 anni
3.072
+0.081
2.72%
1 gen 1990 anni
3.017
-0.055
-1.79%
1 gen 1991 anni
3.13
+0.113
3.76%
1 gen 1992 anni
2.33
-0.8
-25.57%
1 gen 1993 anni
2.594
+0.264
11.33%
1 gen 1994 anni
2.814
+0.22
8.49%
1 gen 1995 anni
2.612
-0.202
-7.19%
1 gen 1996 anni
2.63
+0.018
0.68%
1 gen 1997 anni
3.433
+0.803
30.55%
1 gen 1998 anni
2.846
-0.587
-17.1%
1 gen 1999 anni
1.761
-1.085
-38.13%
1 gen 2000 anni
2.475
+0.715
40.58%
1 gen 2001 anni
4.542
+2.067
83.5%
1 gen 2002 anni
4.007
-0.535
-11.79%
1 gen 2003 anni
3.0
-1.007
-25.13%
1 gen 2004 anni
3.402
+0.403
13.43%
1 gen 2005 anni
4.863
+1.46
42.92%
1 gen 2006 anni
5.003
+0.14
2.88%
1 gen 2007 anni
4.825
-0.178
-3.56%
1 gen 2008 anni
4.505
-0.319
-6.62%
1 gen 2009 anni
5.801
+1.295
28.75%
1 gen 2010 anni
2.35
-3.451
-59.49%
1 gen 2011 anni
2.761
+0.411
17.49%
1 gen 2012 anni
3.202
+0.442
16.0%
1 gen 2013 anni
2.407
-0.795
-24.83%
1 gen 2014 anni
2.556
+0.148
6.15%
1 gen 2015 anni
2.507
-0.048
-1.88%
1 gen 2016 anni
0.889
-1.618
-64.54%
Classificazione dei paesi secondo i statistiche attuali per anni


Commenti: