29
/it/
it
AIzaSyAYiBZKx7MnpbEhh9jyipgxe19OcubqV5w
April 1, 2024
36260
High income
HIC
false
2
1
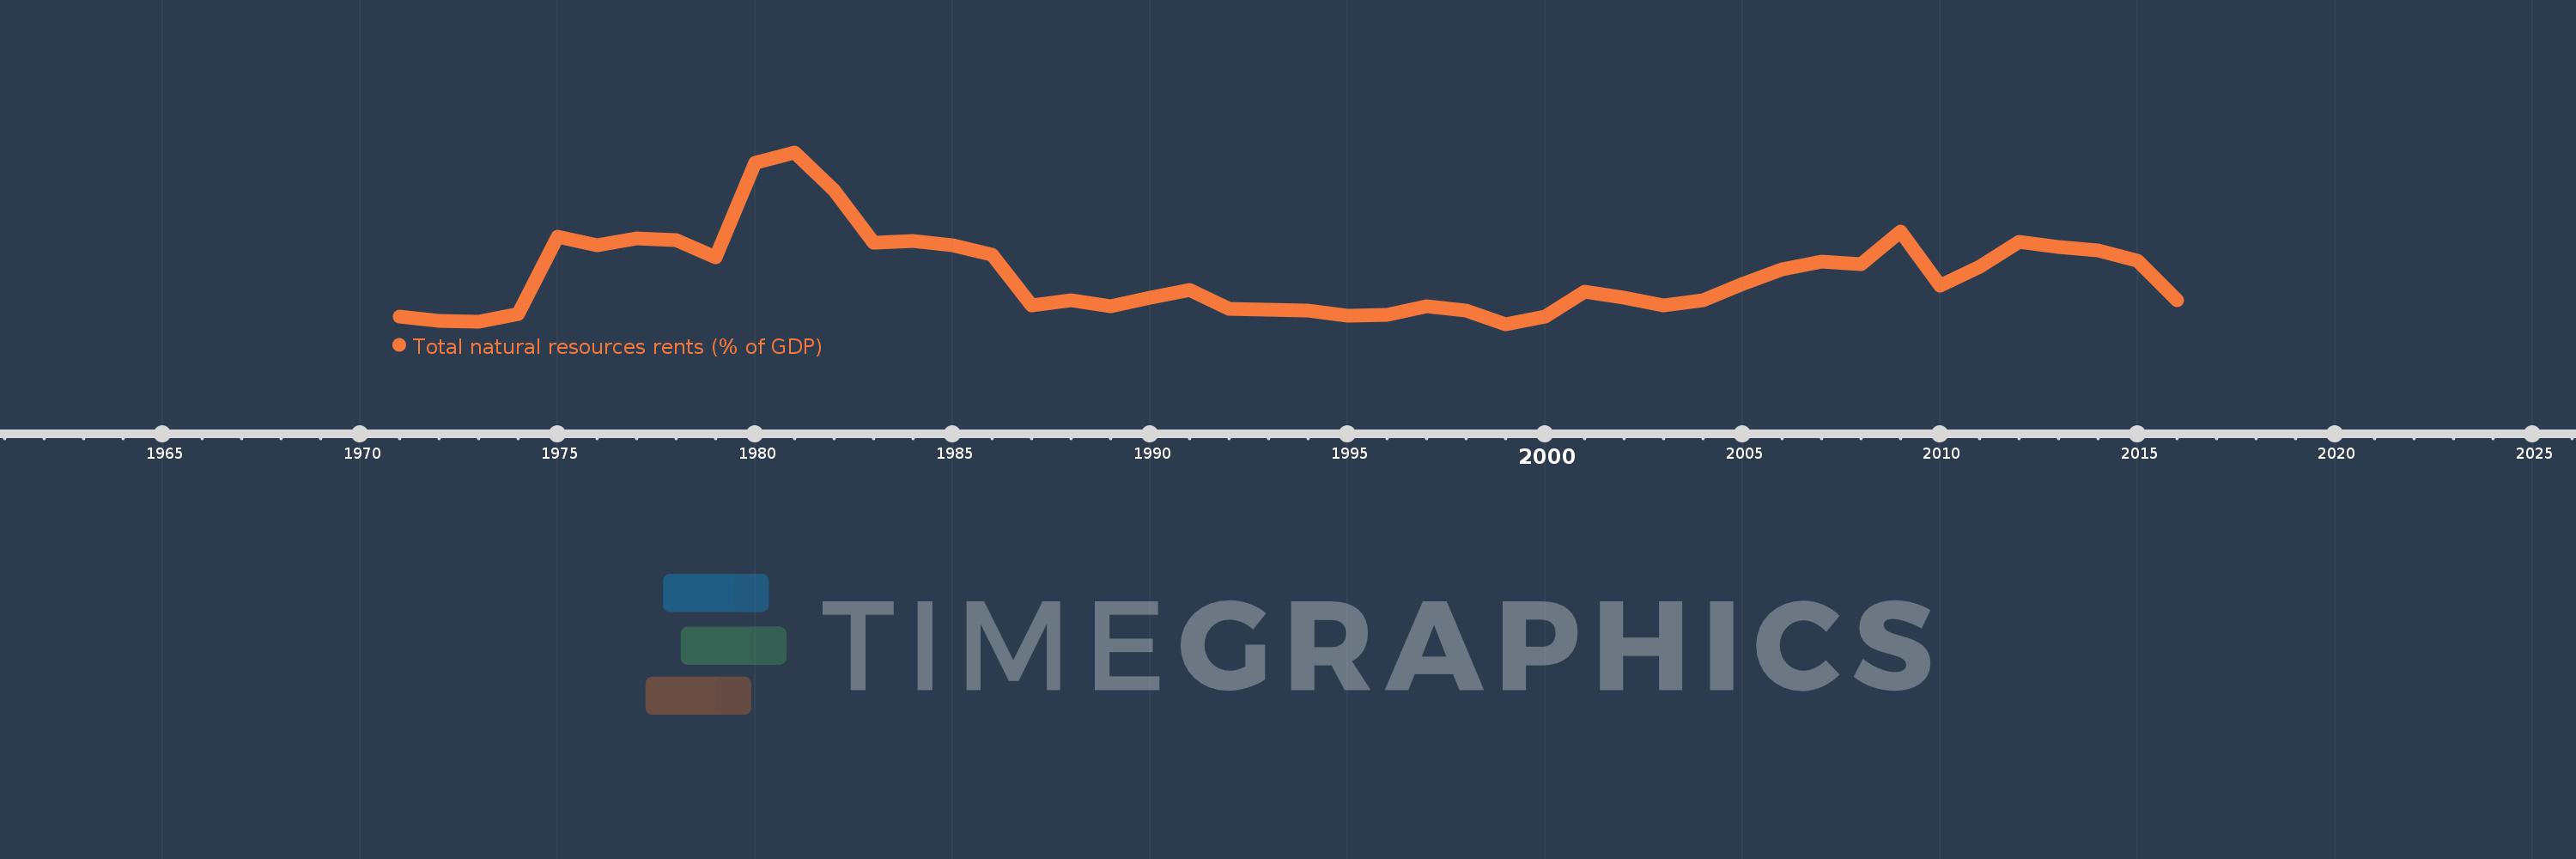
Total natural resources rents (% of GDP)
2016,2015,2014,2013,2012,2011,2010,2009,2008,2007,2006,2005,2004,2003,2002,2001,2000,1999,1998,1997,1996,1995,1994,1993,1992,1991,1990,1989,1988,1987,1986,1985,1984,1983,1982,1981,1980,1979,1978,1977,1976,1975,1974,1973,1972,1971
Queste statistiche in altri paesi:
AfghanistanAlbaniaAlgeriaAngolaArab WorldArgentinaArmeniaArubaAustraliaAustriaAzerbaijanBahamas, TheBahrainBangladeshBarbadosBelarusBelgiumBelizeBeninBhutanBoliviaBosnia and HerzegovinaBotswanaBrazilBrunei DarussalamBulgariaBurkina FasoBurundiCabo VerdeCambodiaCameroonCanadaCaribbean small statesCentral African RepublicCentral Europe and the BalticsChadChileChinaColombiaComorosCongo, Dem. Rep.Congo, Rep.Costa RicaCote d'IvoireCroatiaCubaCyprusCzech RepublicDenmarkDjiboutiDominicaDominican RepublicEarly-demographic dividendEast Asia & PacificEast Asia & Pacific (excluding high income)East Asia & Pacific (IDA & IBRD countries)EcuadorEgypt, Arab Rep.El SalvadorEquatorial GuineaEritreaEstoniaEthiopiaEuro areaEurope & Central AsiaEurope & Central Asia (excluding high income)Europe & Central Asia (IDA & IBRD countries)European UnionFijiFinlandFragile and conflict affected situationsFranceFrench PolynesiaGabonGambia, TheGeorgiaGermanyGhanaGreeceGuatemalaGuineaGuinea-BissauGuyanaHaitiHeavily indebted poor countries (HIPC)High incomeHondurasHong Kong SAR, ChinaHungaryIBRD onlyIcelandIDA & IBRD totalIDA blendIDA onlyIDA totalIndiaIndonesiaIran, Islamic Rep.IraqIrelandIsraelItalyJamaicaJapanJordanKazakhstanKenyaKiribatiKorea, Rep.KuwaitKyrgyz RepublicLao PDRLate-demographic dividendLatin America & Caribbean Latin America & Caribbean (excluding high income)Latin America & the Caribbean (IDA & IBRD countries)LatviaLeast developed countries: UN classificationLebanonLesothoLiberiaLibyaLithuaniaLow & middle incomeLow incomeLower middle incomeLuxembourgMacao SAR, ChinaMacedonia, FYRMadagascarMalawiMalaysiaMaldivesMaliMaltaMauritaniaMauritiusMexicoMiddle East & North AfricaMiddle East & North Africa (excluding high income)Middle East & North Africa (IDA & IBRD countries)Middle incomeMoldovaMongoliaMontenegroMoroccoMozambiqueMyanmarNamibiaNepalNetherlandsNew CaledoniaNew ZealandNicaraguaNigerNigeriaNorth AmericaNorwayOECD membersOmanOther small statesPacific island small statesPakistanPanamaPapua New GuineaParaguayPeruPhilippinesPolandPortugalPost-demographic dividendPre-demographic dividendQatarRomaniaRussian FederationRwandaSamoaSao Tome and PrincipeSaudi ArabiaSenegalSerbiaSeychellesSierra LeoneSingaporeSlovak RepublicSloveniaSmall statesSolomon IslandsSouth AfricaSouth AsiaSouth Asia (IDA & IBRD)South SudanSpainSri LankaSt. LuciaSt. Vincent and the GrenadinesSub-Saharan Africa Sub-Saharan Africa (excluding high income)Sub-Saharan Africa (IDA & IBRD countries)SudanSurinameSwazilandSwedenSwitzerlandSyrian Arab RepublicTajikistanTanzaniaThailandTimor-LesteTogoTongaTrinidad and TobagoTunisiaTurkeyTurkmenistanUgandaUkraineUnited Arab EmiratesUnited KingdomUnited StatesUpper middle incomeUruguayUzbekistanVanuatuVenezuela, RBVietnamWorldYemen, Rep.ZambiaZimbabwe Linea del tempo:
Questa scala temporale mostra un grafico dal 1971 anno al 2016 anno. High income. I dati fino ad 1970 anno non disponibili. Il numero di osservazioni attuali secondo i date: 46.
La fonte (nome):
Indicatori dello sviluppo mondiale
La fonte (organizzazione):
Estimates based on sources and methods described in "The Changing Wealth of Nations: Measuring Sustainable Development in the New Millennium" (World Bank, 2011).
Categorie:
Energy & Mining, Environment
sono stati aggiornati
23 apr 2017 anni
Indicatori delle variazioni dei valori per anni
Minima:
0.501
1 gen 1999 anni
Massimo:
4.504
1 gen 1981 anni
Alla data di osservazione
Valore
Variazione assoluta
La variazione rispetto al valore precedente
1 gen 1971 anni
0.676
+0.676
0.0%
1 gen 1972 anni
0.578
-0.098
-14.52%
1 gen 1973 anni
0.558
-0.02
-3.45%
1 gen 1974 anni
0.742
+0.184
33.03%
1 gen 1975 anni
2.534
+1.792
241.47%
1 gen 1976 anni
2.341
-0.193
-7.6%
1 gen 1977 anni
2.502
+0.161
6.86%
1 gen 1978 anni
2.463
-0.039
-1.56%
1 gen 1979 anni
2.052
-0.412
-16.71%
1 gen 1980 anni
4.262
+2.21
107.74%
1 gen 1981 anni
4.504
+0.242
5.68%
1 gen 1982 anni
3.616
-0.888
-19.71%
1 gen 1983 anni
2.401
-1.215
-33.61%
1 gen 1984 anni
2.435
+0.034
1.42%
1 gen 1985 anni
2.346
-0.089
-3.65%
1 gen 1986 anni
2.126
-0.22
-9.39%
1 gen 1987 anni
0.936
-1.19
-55.97%
1 gen 1988 anni
1.058
+0.122
13.06%
1 gen 1989 anni
0.921
-0.137
-12.95%
1 gen 1990 anni
1.12
+0.198
21.53%
1 gen 1991 anni
1.302
+0.183
16.3%
1 gen 1992 anni
0.863
-0.439
-33.73%
1 gen 1993 anni
0.845
-0.018
-2.11%
1 gen 1994 anni
0.816
-0.029
-3.39%
1 gen 1995 anni
0.7
-0.116
-14.17%
1 gen 1996 anni
0.714
+0.013
1.89%
1 gen 1997 anni
0.918
+0.204
28.55%
1 gen 1998 anni
0.824
-0.093
-10.19%
1 gen 1999 anni
0.501
-0.323
-39.18%
1 gen 2000 anni
0.675
+0.174
34.7%
1 gen 2001 anni
1.258
+0.583
86.3%
1 gen 2002 anni
1.128
-0.129
-10.29%
1 gen 2003 anni
0.931
-0.197
-17.47%
1 gen 2004 anni
1.059
+0.128
13.75%
1 gen 2005 anni
1.431
+0.372
35.12%
1 gen 2006 anni
1.781
+0.35
24.44%
1 gen 2007 anni
1.969
+0.188
10.53%
1 gen 2008 anni
1.907
-0.062
-3.14%
1 gen 2009 anni
2.659
+0.752
39.46%
1 gen 2010 anni
1.392
-1.268
-47.67%
1 gen 2011 anni
1.845
+0.454
32.6%
1 gen 2012 anni
2.425
+0.579
31.39%
1 gen 2013 anni
2.303
-0.121
-4.99%
1 gen 2014 anni
2.218
-0.086
-3.72%
1 gen 2015 anni
1.985
-0.233
-10.49%
1 gen 2016 anni
1.066
-0.919
-46.29%
Classificazione dei paesi secondo i statistiche attuali per anni


Commenti: