29
/it/
it
AIzaSyAYiBZKx7MnpbEhh9jyipgxe19OcubqV5w
April 1, 2024
220320
Papua New Guinea
PNG
true
2
1
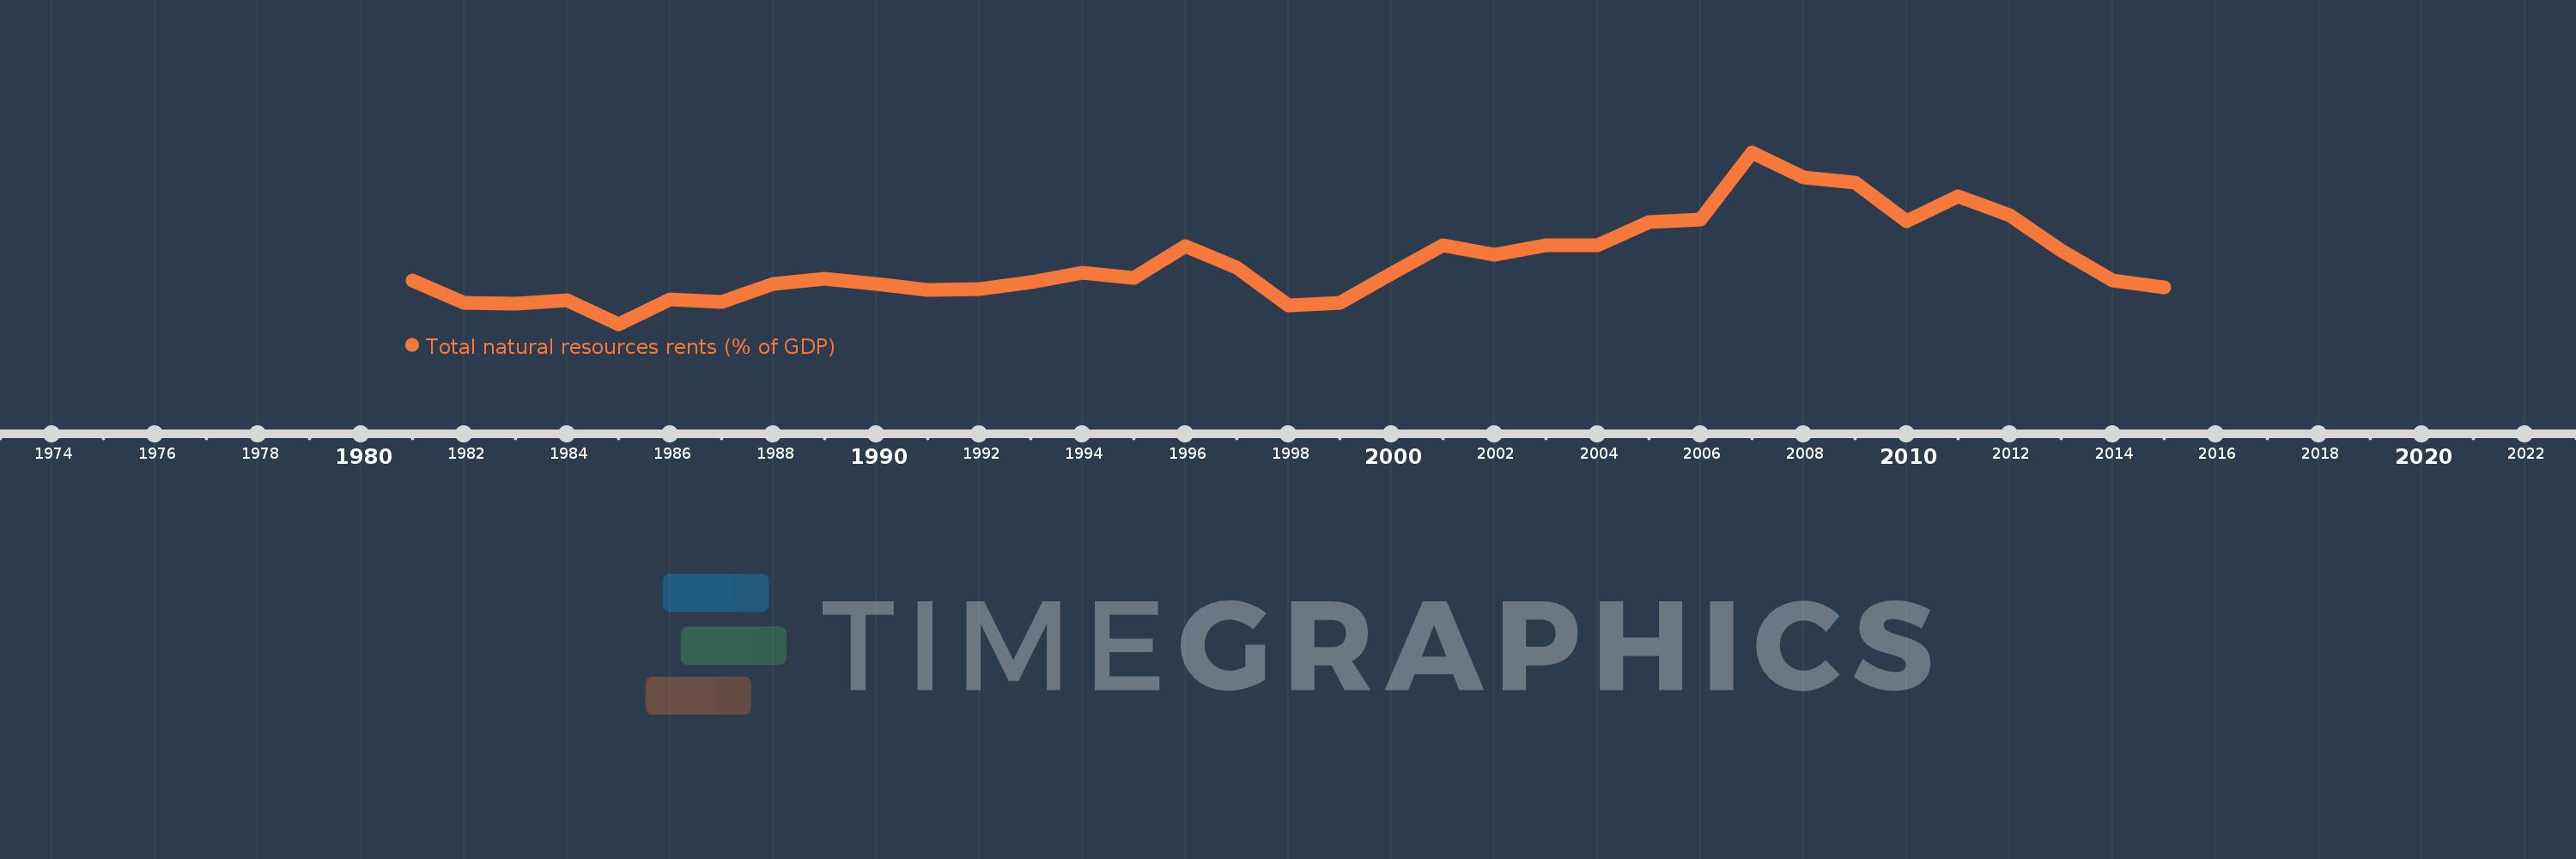
Total natural resources rents (% of GDP)
2015,2014,2013,2012,2011,2010,2009,2008,2007,2006,2005,2004,2003,2002,2001,2000,1999,1998,1997,1996,1995,1994,1993,1992,1991,1990,1989,1988,1987,1986,1985,1984,1983,1982,1981
Queste statistiche in altri paesi:
AfghanistanAlbaniaAlgeriaAngolaArab WorldArgentinaArmeniaArubaAustraliaAustriaAzerbaijanBahamas, TheBahrainBangladeshBarbadosBelarusBelgiumBelizeBeninBhutanBoliviaBosnia and HerzegovinaBotswanaBrazilBrunei DarussalamBulgariaBurkina FasoBurundiCabo VerdeCambodiaCameroonCanadaCaribbean small statesCentral African RepublicCentral Europe and the BalticsChadChileChinaColombiaComorosCongo, Dem. Rep.Congo, Rep.Costa RicaCote d'IvoireCroatiaCubaCyprusCzech RepublicDenmarkDjiboutiDominicaDominican RepublicEarly-demographic dividendEast Asia & PacificEast Asia & Pacific (excluding high income)East Asia & Pacific (IDA & IBRD countries)EcuadorEgypt, Arab Rep.El SalvadorEquatorial GuineaEritreaEstoniaEthiopiaEuro areaEurope & Central AsiaEurope & Central Asia (excluding high income)Europe & Central Asia (IDA & IBRD countries)European UnionFijiFinlandFragile and conflict affected situationsFranceFrench PolynesiaGabonGambia, TheGeorgiaGermanyGhanaGreeceGuatemalaGuineaGuinea-BissauGuyanaHaitiHeavily indebted poor countries (HIPC)High incomeHondurasHong Kong SAR, ChinaHungaryIBRD onlyIcelandIDA & IBRD totalIDA blendIDA onlyIDA totalIndiaIndonesiaIran, Islamic Rep.IraqIrelandIsraelItalyJamaicaJapanJordanKazakhstanKenyaKiribatiKorea, Rep.KuwaitKyrgyz RepublicLao PDRLate-demographic dividendLatin America & Caribbean Latin America & Caribbean (excluding high income)Latin America & the Caribbean (IDA & IBRD countries)LatviaLeast developed countries: UN classificationLebanonLesothoLiberiaLibyaLithuaniaLow & middle incomeLow incomeLower middle incomeLuxembourgMacao SAR, ChinaMacedonia, FYRMadagascarMalawiMalaysiaMaldivesMaliMaltaMauritaniaMauritiusMexicoMiddle East & North AfricaMiddle East & North Africa (excluding high income)Middle East & North Africa (IDA & IBRD countries)Middle incomeMoldovaMongoliaMontenegroMoroccoMozambiqueMyanmarNamibiaNepalNetherlandsNew CaledoniaNew ZealandNicaraguaNigerNigeriaNorth AmericaNorwayOECD membersOmanOther small statesPacific island small statesPakistanPanamaPapua New GuineaParaguayPeruPhilippinesPolandPortugalPost-demographic dividendPre-demographic dividendQatarRomaniaRussian FederationRwandaSamoaSao Tome and PrincipeSaudi ArabiaSenegalSerbiaSeychellesSierra LeoneSingaporeSlovak RepublicSloveniaSmall statesSolomon IslandsSouth AfricaSouth AsiaSouth Asia (IDA & IBRD)South SudanSpainSri LankaSt. LuciaSt. Vincent and the GrenadinesSub-Saharan Africa Sub-Saharan Africa (excluding high income)Sub-Saharan Africa (IDA & IBRD countries)SudanSurinameSwazilandSwedenSwitzerlandSyrian Arab RepublicTajikistanTanzaniaThailandTimor-LesteTogoTongaTrinidad and TobagoTunisiaTurkeyTurkmenistanUgandaUkraineUnited Arab EmiratesUnited KingdomUnited StatesUpper middle incomeUruguayUzbekistanVanuatuVenezuela, RBVietnamWorldYemen, Rep.ZambiaZimbabwe Linea del tempo:
Questa scala temporale mostra un grafico dal 1981 anno al 2015 anno. Papua New Guinea. I dati fino ad 1980 anno non disponibili. Il numero di osservazioni attuali secondo i date: 35.
La fonte (nome):
Indicatori dello sviluppo mondiale
La fonte (organizzazione):
Estimates based on sources and methods described in "The Changing Wealth of Nations: Measuring Sustainable Development in the New Millennium" (World Bank, 2011).
Categorie:
Energy & Mining, Environment
sono stati aggiornati
23 apr 2017 anni
Indicatori delle variazioni dei valori per anni
Minima:
15.514
1 gen 1985 anni
Massimo:
53.152
1 gen 2007 anni
Alla data di osservazione
Valore
Variazione assoluta
La variazione rispetto al valore precedente
1 gen 1981 anni
25.151
+25.151
0.0%
1 gen 1982 anni
20.129
-5.021
-19.97%
1 gen 1983 anni
19.937
-0.192
-0.95%
1 gen 1984 anni
20.852
+0.915
4.59%
1 gen 1985 anni
15.514
-5.338
-25.6%
1 gen 1986 anni
21.017
+5.503
35.47%
1 gen 1987 anni
20.396
-0.622
-2.96%
1 gen 1988 anni
24.259
+3.863
18.94%
1 gen 1989 anni
25.46
+1.201
4.95%
1 gen 1990 anni
24.362
-1.098
-4.31%
1 gen 1991 anni
22.929
-1.433
-5.88%
1 gen 1992 anni
23.246
+0.317
1.38%
1 gen 1993 anni
24.688
+1.441
6.2%
1 gen 1994 anni
26.843
+2.156
8.73%
1 gen 1995 anni
25.565
-1.279
-4.76%
1 gen 1996 anni
32.533
+6.969
27.26%
1 gen 1997 anni
27.827
-4.706
-14.47%
1 gen 1998 anni
19.622
-8.206
-29.49%
1 gen 1999 anni
20.181
+0.559
2.85%
1 gen 2000 anni
26.68
+6.499
32.2%
1 gen 2001 anni
32.796
+6.116
22.92%
1 gen 2002 anni
30.74
-2.056
-6.27%
1 gen 2003 anni
32.784
+2.044
6.65%
1 gen 2004 anni
32.878
+0.094
0.29%
1 gen 2005 anni
37.922
+5.044
15.34%
1 gen 2006 anni
38.439
+0.516
1.36%
1 gen 2007 anni
53.152
+14.713
38.28%
1 gen 2008 anni
47.686
-5.466
-10.28%
1 gen 2009 anni
46.53
-1.156
-2.42%
1 gen 2010 anni
38.076
-8.454
-18.17%
1 gen 2011 anni
43.453
+5.377
14.12%
1 gen 2012 anni
39.421
-4.032
-9.28%
1 gen 2013 anni
31.668
-7.754
-19.67%
1 gen 2014 anni
25.104
-6.564
-20.73%
1 gen 2015 anni
23.514
-1.59
-6.33%
Classificazione dei paesi secondo i statistiche attuali per anni


Commenti: