29
/it/
it
AIzaSyAYiBZKx7MnpbEhh9jyipgxe19OcubqV5w
April 1, 2024
46748
Low income
LIC
false
2
1
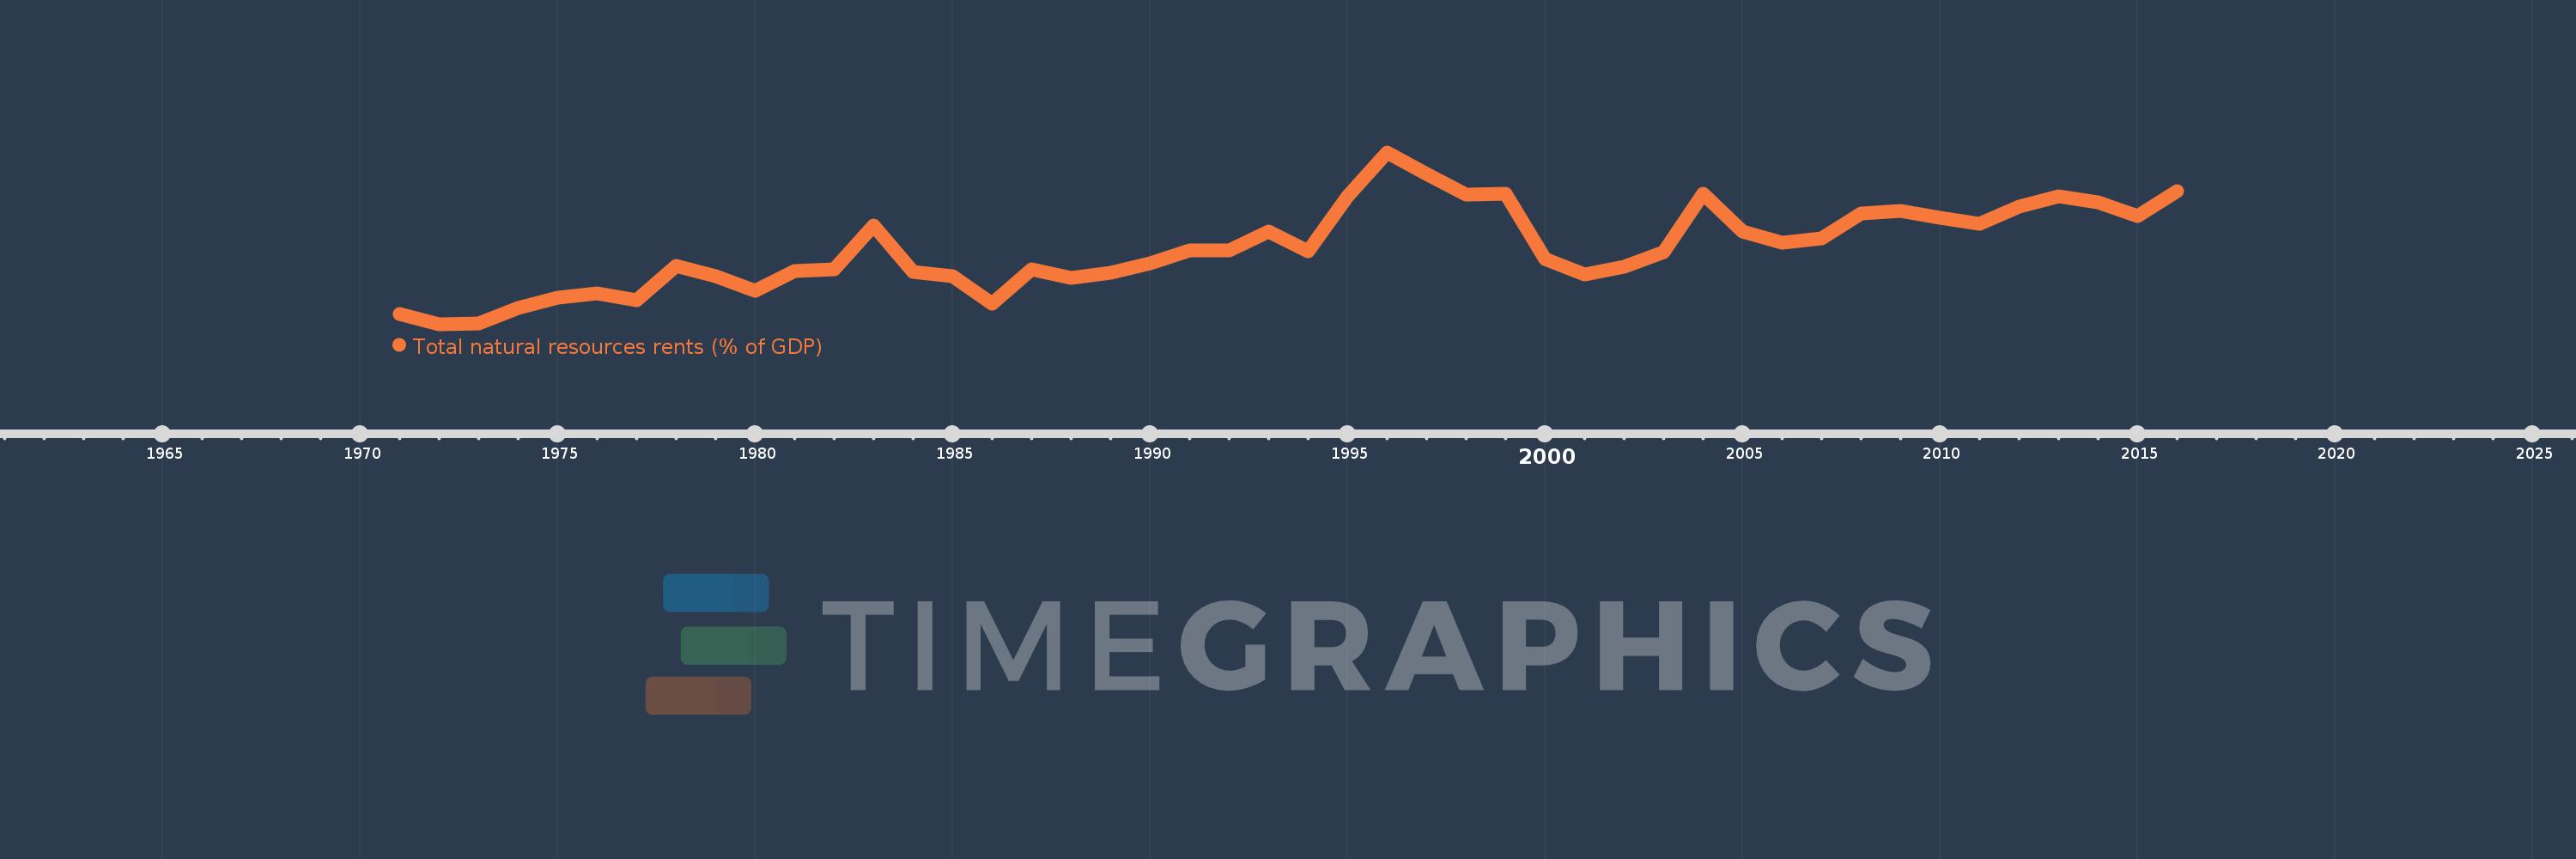
Total natural resources rents (% of GDP)
2016,2015,2014,2013,2012,2011,2010,2009,2008,2007,2006,2005,2004,2003,2002,2001,2000,1999,1998,1997,1996,1995,1994,1993,1992,1991,1990,1989,1988,1987,1986,1985,1984,1983,1982,1981,1980,1979,1978,1977,1976,1975,1974,1973,1972,1971
Queste statistiche in altri paesi:
AfghanistanAlbaniaAlgeriaAngolaArab WorldArgentinaArmeniaArubaAustraliaAustriaAzerbaijanBahamas, TheBahrainBangladeshBarbadosBelarusBelgiumBelizeBeninBhutanBoliviaBosnia and HerzegovinaBotswanaBrazilBrunei DarussalamBulgariaBurkina FasoBurundiCabo VerdeCambodiaCameroonCanadaCaribbean small statesCentral African RepublicCentral Europe and the BalticsChadChileChinaColombiaComorosCongo, Dem. Rep.Congo, Rep.Costa RicaCote d'IvoireCroatiaCubaCyprusCzech RepublicDenmarkDjiboutiDominicaDominican RepublicEarly-demographic dividendEast Asia & PacificEast Asia & Pacific (excluding high income)East Asia & Pacific (IDA & IBRD countries)EcuadorEgypt, Arab Rep.El SalvadorEquatorial GuineaEritreaEstoniaEthiopiaEuro areaEurope & Central AsiaEurope & Central Asia (excluding high income)Europe & Central Asia (IDA & IBRD countries)European UnionFijiFinlandFragile and conflict affected situationsFranceFrench PolynesiaGabonGambia, TheGeorgiaGermanyGhanaGreeceGuatemalaGuineaGuinea-BissauGuyanaHaitiHeavily indebted poor countries (HIPC)High incomeHondurasHong Kong SAR, ChinaHungaryIBRD onlyIcelandIDA & IBRD totalIDA blendIDA onlyIDA totalIndiaIndonesiaIran, Islamic Rep.IraqIrelandIsraelItalyJamaicaJapanJordanKazakhstanKenyaKiribatiKorea, Rep.KuwaitKyrgyz RepublicLao PDRLate-demographic dividendLatin America & Caribbean Latin America & Caribbean (excluding high income)Latin America & the Caribbean (IDA & IBRD countries)LatviaLeast developed countries: UN classificationLebanonLesothoLiberiaLibyaLithuaniaLow & middle incomeLow incomeLower middle incomeLuxembourgMacao SAR, ChinaMacedonia, FYRMadagascarMalawiMalaysiaMaldivesMaliMaltaMauritaniaMauritiusMexicoMiddle East & North AfricaMiddle East & North Africa (excluding high income)Middle East & North Africa (IDA & IBRD countries)Middle incomeMoldovaMongoliaMontenegroMoroccoMozambiqueMyanmarNamibiaNepalNetherlandsNew CaledoniaNew ZealandNicaraguaNigerNigeriaNorth AmericaNorwayOECD membersOmanOther small statesPacific island small statesPakistanPanamaPapua New GuineaParaguayPeruPhilippinesPolandPortugalPost-demographic dividendPre-demographic dividendQatarRomaniaRussian FederationRwandaSamoaSao Tome and PrincipeSaudi ArabiaSenegalSerbiaSeychellesSierra LeoneSingaporeSlovak RepublicSloveniaSmall statesSolomon IslandsSouth AfricaSouth AsiaSouth Asia (IDA & IBRD)South SudanSpainSri LankaSt. LuciaSt. Vincent and the GrenadinesSub-Saharan Africa Sub-Saharan Africa (excluding high income)Sub-Saharan Africa (IDA & IBRD countries)SudanSurinameSwazilandSwedenSwitzerlandSyrian Arab RepublicTajikistanTanzaniaThailandTimor-LesteTogoTongaTrinidad and TobagoTunisiaTurkeyTurkmenistanUgandaUkraineUnited Arab EmiratesUnited KingdomUnited StatesUpper middle incomeUruguayUzbekistanVanuatuVenezuela, RBVietnamWorldYemen, Rep.ZambiaZimbabwe Linea del tempo:
Questa scala temporale mostra un grafico dal 1971 anno al 2016 anno. Low income. I dati fino ad 1970 anno non disponibili. Il numero di osservazioni attuali secondo i date: 46.
La fonte (nome):
Indicatori dello sviluppo mondiale
La fonte (organizzazione):
Estimates based on sources and methods described in "The Changing Wealth of Nations: Measuring Sustainable Development in the New Millennium" (World Bank, 2011).
Categorie:
Energy & Mining, Environment
sono stati aggiornati
23 apr 2017 anni
Indicatori delle variazioni dei valori per anni
Minima:
3.901
1 gen 1972 anni
Massimo:
15.221
1 gen 1996 anni
Alla data di osservazione
Valore
Variazione assoluta
La variazione rispetto al valore precedente
1 gen 1971 anni
4.575
+4.575
0.0%
1 gen 1972 anni
3.901
-0.674
-14.74%
1 gen 1973 anni
3.977
+0.076
1.95%
1 gen 1974 anni
4.966
+0.989
24.87%
1 gen 1975 anni
5.673
+0.707
14.24%
1 gen 1976 anni
5.938
+0.265
4.67%
1 gen 1977 anni
5.491
-0.447
-7.53%
1 gen 1978 anni
7.763
+2.272
41.38%
1 gen 1979 anni
7.037
-0.726
-9.35%
1 gen 1980 anni
6.093
-0.944
-13.41%
1 gen 1981 anni
7.404
+1.311
21.52%
1 gen 1982 anni
7.544
+0.14
1.9%
1 gen 1983 anni
10.43
+2.886
38.25%
1 gen 1984 anni
7.353
-3.077
-29.5%
1 gen 1985 anni
7.053
-0.3
-4.08%
1 gen 1986 anni
5.267
-1.786
-25.32%
1 gen 1987 anni
7.543
+2.276
43.21%
1 gen 1988 anni
6.962
-0.581
-7.7%
1 gen 1989 anni
7.299
+0.336
4.83%
1 gen 1990 anni
7.937
+0.638
8.74%
1 gen 1991 anni
8.744
+0.807
10.17%
1 gen 1992 anni
8.757
+0.014
0.16%
1 gen 1993 anni
9.991
+1.234
14.09%
1 gen 1994 anni
8.732
-1.259
-12.6%
1 gen 1995 anni
12.333
+3.601
41.24%
1 gen 1996 anni
15.221
+2.888
23.41%
1 gen 1997 anni
13.814
-1.407
-9.24%
1 gen 1998 anni
12.451
-1.364
-9.87%
1 gen 1999 anni
12.476
+0.025
0.2%
1 gen 2000 anni
8.209
-4.267
-34.2%
1 gen 2001 anni
7.206
-1.003
-12.21%
1 gen 2002 anni
7.67
+0.464
6.44%
1 gen 2003 anni
8.648
+0.978
12.75%
1 gen 2004 anni
12.486
+3.838
44.38%
1 gen 2005 anni
9.996
-2.49
-19.94%
1 gen 2006 anni
9.282
-0.714
-7.14%
1 gen 2007 anni
9.53
+0.248
2.67%
1 gen 2008 anni
11.177
+1.647
17.28%
1 gen 2009 anni
11.35
+0.173
1.55%
1 gen 2010 anni
10.893
-0.457
-4.03%
1 gen 2011 anni
10.522
-0.371
-3.41%
1 gen 2012 anni
11.63
+1.108
10.53%
1 gen 2013 anni
12.326
+0.696
5.98%
1 gen 2014 anni
11.95
-0.375
-3.05%
1 gen 2015 anni
11.021
-0.929
-7.77%
1 gen 2016 anni
12.661
+1.64
14.88%
Classificazione dei paesi secondo i statistiche attuali per anni


Commenti: