29
/it/
it
AIzaSyAYiBZKx7MnpbEhh9jyipgxe19OcubqV5w
April 1, 2024
116293
Cuba
CUB
true
2
1
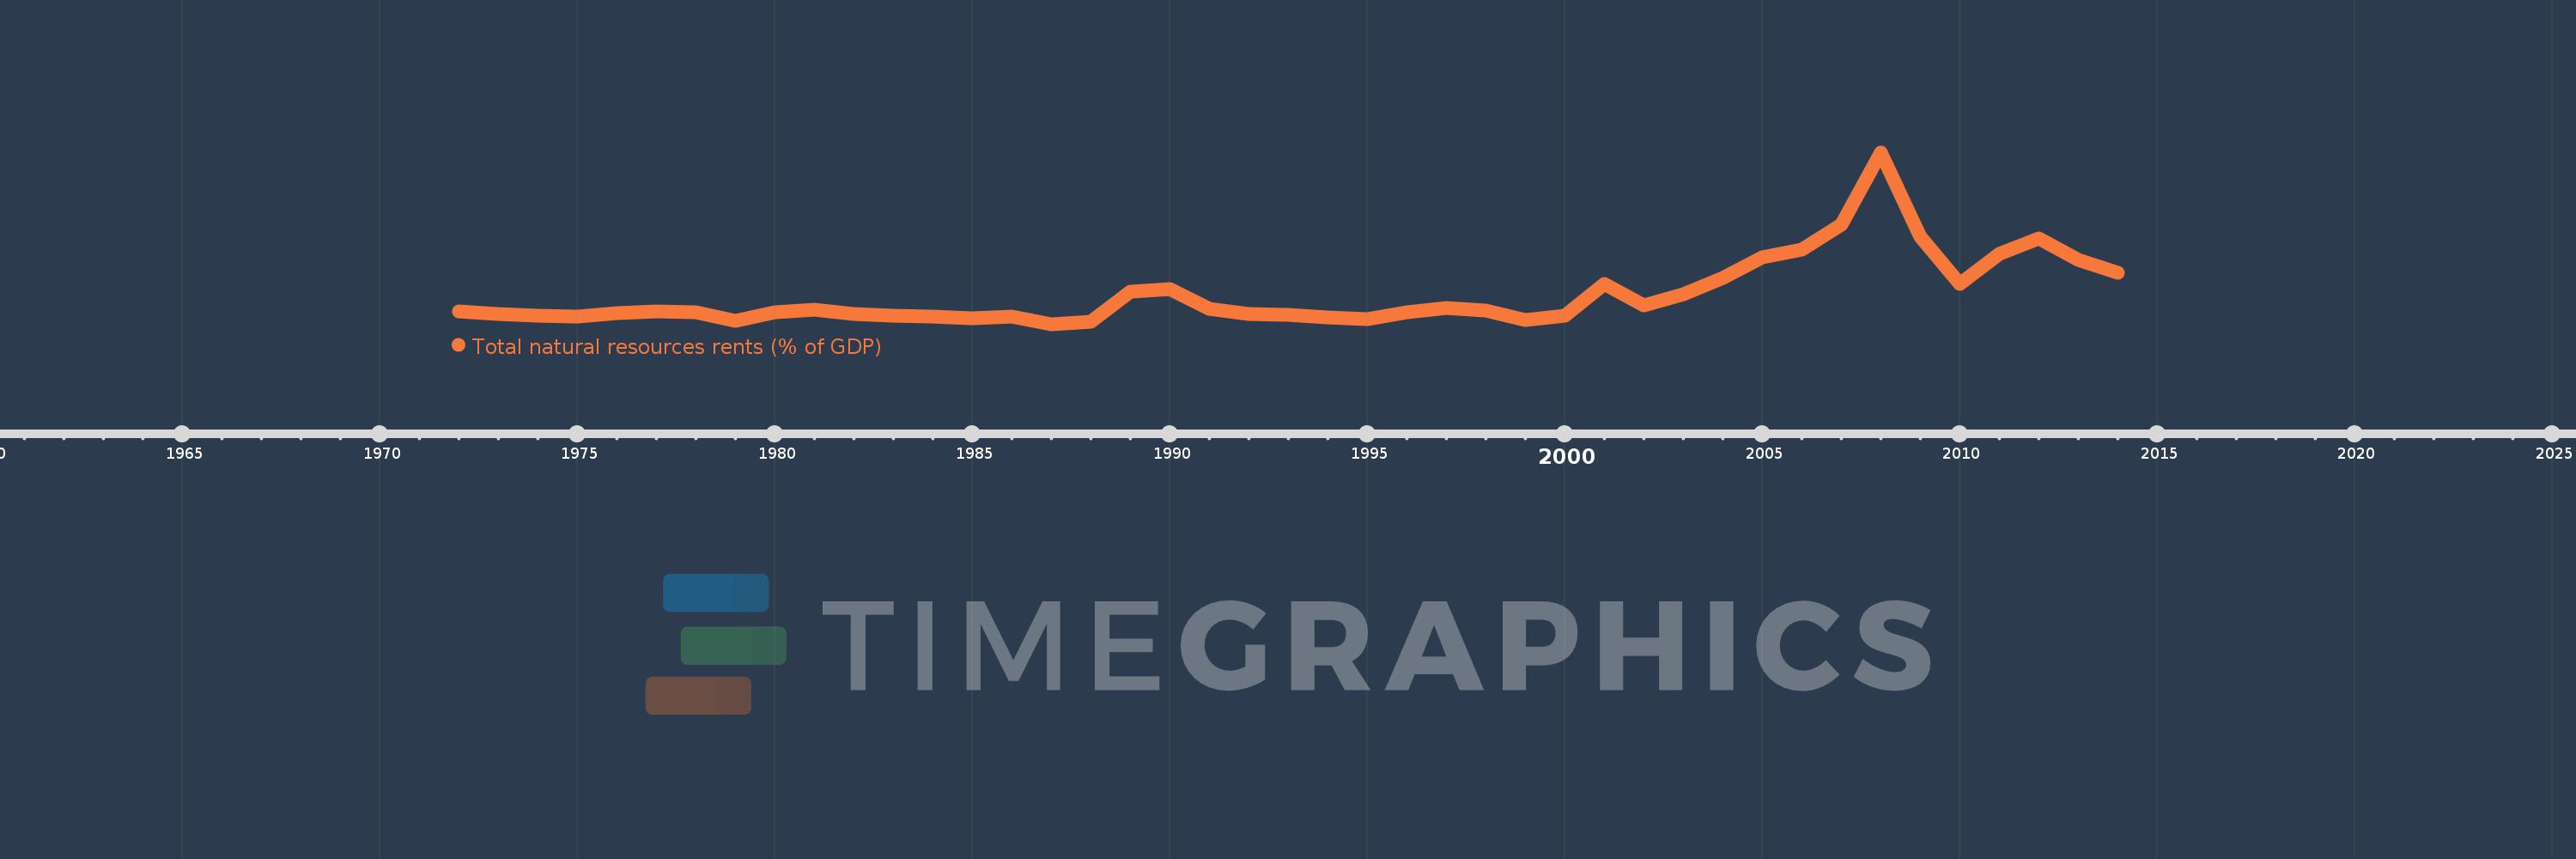
Total natural resources rents (% of GDP)
2014,2013,2012,2011,2010,2009,2008,2007,2006,2005,2004,2003,2002,2001,2000,1999,1998,1997,1996,1995,1994,1993,1992,1991,1990,1989,1988,1987,1986,1985,1984,1983,1982,1981,1980,1979,1978,1977,1976,1975,1974,1973,1972
Queste statistiche in altri paesi:
AfghanistanAlbaniaAlgeriaAngolaArab WorldArgentinaArmeniaArubaAustraliaAustriaAzerbaijanBahamas, TheBahrainBangladeshBarbadosBelarusBelgiumBelizeBeninBhutanBoliviaBosnia and HerzegovinaBotswanaBrazilBrunei DarussalamBulgariaBurkina FasoBurundiCabo VerdeCambodiaCameroonCanadaCaribbean small statesCentral African RepublicCentral Europe and the BalticsChadChileChinaColombiaComorosCongo, Dem. Rep.Congo, Rep.Costa RicaCote d'IvoireCroatiaCubaCyprusCzech RepublicDenmarkDjiboutiDominicaDominican RepublicEarly-demographic dividendEast Asia & PacificEast Asia & Pacific (excluding high income)East Asia & Pacific (IDA & IBRD countries)EcuadorEgypt, Arab Rep.El SalvadorEquatorial GuineaEritreaEstoniaEthiopiaEuro areaEurope & Central AsiaEurope & Central Asia (excluding high income)Europe & Central Asia (IDA & IBRD countries)European UnionFijiFinlandFragile and conflict affected situationsFranceFrench PolynesiaGabonGambia, TheGeorgiaGermanyGhanaGreeceGuatemalaGuineaGuinea-BissauGuyanaHaitiHeavily indebted poor countries (HIPC)High incomeHondurasHong Kong SAR, ChinaHungaryIBRD onlyIcelandIDA & IBRD totalIDA blendIDA onlyIDA totalIndiaIndonesiaIran, Islamic Rep.IraqIrelandIsraelItalyJamaicaJapanJordanKazakhstanKenyaKiribatiKorea, Rep.KuwaitKyrgyz RepublicLao PDRLate-demographic dividendLatin America & Caribbean Latin America & Caribbean (excluding high income)Latin America & the Caribbean (IDA & IBRD countries)LatviaLeast developed countries: UN classificationLebanonLesothoLiberiaLibyaLithuaniaLow & middle incomeLow incomeLower middle incomeLuxembourgMacao SAR, ChinaMacedonia, FYRMadagascarMalawiMalaysiaMaldivesMaliMaltaMauritaniaMauritiusMexicoMiddle East & North AfricaMiddle East & North Africa (excluding high income)Middle East & North Africa (IDA & IBRD countries)Middle incomeMoldovaMongoliaMontenegroMoroccoMozambiqueMyanmarNamibiaNepalNetherlandsNew CaledoniaNew ZealandNicaraguaNigerNigeriaNorth AmericaNorwayOECD membersOmanOther small statesPacific island small statesPakistanPanamaPapua New GuineaParaguayPeruPhilippinesPolandPortugalPost-demographic dividendPre-demographic dividendQatarRomaniaRussian FederationRwandaSamoaSao Tome and PrincipeSaudi ArabiaSenegalSerbiaSeychellesSierra LeoneSingaporeSlovak RepublicSloveniaSmall statesSolomon IslandsSouth AfricaSouth AsiaSouth Asia (IDA & IBRD)South SudanSpainSri LankaSt. LuciaSt. Vincent and the GrenadinesSub-Saharan Africa Sub-Saharan Africa (excluding high income)Sub-Saharan Africa (IDA & IBRD countries)SudanSurinameSwazilandSwedenSwitzerlandSyrian Arab RepublicTajikistanTanzaniaThailandTimor-LesteTogoTongaTrinidad and TobagoTunisiaTurkeyTurkmenistanUgandaUkraineUnited Arab EmiratesUnited KingdomUnited StatesUpper middle incomeUruguayUzbekistanVanuatuVenezuela, RBVietnamWorldYemen, Rep.ZambiaZimbabwe Linea del tempo:
Questa scala temporale mostra un grafico dal 1972 anno al 2014 anno. Cuba. I dati fino ad 1971 anno non disponibili. Il numero di osservazioni attuali secondo i date: 43.
La fonte (nome):
Indicatori dello sviluppo mondiale
La fonte (organizzazione):
Estimates based on sources and methods described in "The Changing Wealth of Nations: Measuring Sustainable Development in the New Millennium" (World Bank, 2011).
Categorie:
Energy & Mining, Environment
sono stati aggiornati
23 apr 2017 anni
Indicatori delle variazioni dei valori per anni
Minima:
0.218
1 gen 1987 anni
Massimo:
6.904
1 gen 2008 anni
Alla data di osservazione
Valore
Variazione assoluta
La variazione rispetto al valore precedente
1 gen 1972 anni
0.709
+0.709
0.0%
1 gen 1973 anni
0.626
-0.082
-11.61%
1 gen 1974 anni
0.554
-0.072
-11.54%
1 gen 1975 anni
0.523
-0.031
-5.6%
1 gen 1976 anni
0.65
+0.127
24.28%
1 gen 1977 anni
0.712
+0.062
9.48%
1 gen 1978 anni
0.686
-0.026
-3.6%
1 gen 1979 anni
0.352
-0.334
-48.75%
1 gen 1980 anni
0.671
+0.319
90.76%
1 gen 1981 anni
0.787
+0.116
17.33%
1 gen 1982 anni
0.61
-0.177
-22.53%
1 gen 1983 anni
0.563
-0.047
-7.64%
1 gen 1984 anni
0.511
-0.052
-9.3%
1 gen 1985 anni
0.435
-0.075
-14.72%
1 gen 1986 anni
0.501
+0.065
14.99%
1 gen 1987 anni
0.218
-0.283
-56.52%
1 gen 1988 anni
0.314
+0.096
44.07%
1 gen 1989 anni
1.472
+1.159
369.38%
1 gen 1990 anni
1.585
+0.113
7.65%
1 gen 1991 anni
0.803
-0.782
-49.34%
1 gen 1992 anni
0.621
-0.182
-22.68%
1 gen 1993 anni
0.596
-0.025
-4.0%
1 gen 1994 anni
0.487
-0.109
-18.22%
1 gen 1995 anni
0.43
-0.058
-11.84%
1 gen 1996 anni
0.698
+0.268
62.48%
1 gen 1997 anni
0.856
+0.158
22.64%
1 gen 1998 anni
0.758
-0.098
-11.47%
1 gen 1999 anni
0.38
-0.378
-49.89%
1 gen 2000 anni
0.555
+0.175
46.18%
1 gen 2001 anni
1.773
+1.218
219.27%
1 gen 2002 anni
0.937
-0.836
-47.13%
1 gen 2003 anni
1.368
+0.431
45.95%
1 gen 2004 anni
2.027
+0.659
48.18%
1 gen 2005 anni
2.807
+0.78
38.48%
1 gen 2006 anni
3.134
+0.327
11.65%
1 gen 2007 anni
4.104
+0.97
30.97%
1 gen 2008 anni
6.904
+2.8
68.22%
1 gen 2009 anni
3.622
-3.282
-47.54%
1 gen 2010 anni
1.783
-1.838
-50.76%
1 gen 2011 anni
2.964
+1.18
66.18%
1 gen 2012 anni
3.561
+0.597
20.14%
1 gen 2013 anni
2.722
-0.838
-23.54%
1 gen 2014 anni
2.214
-0.508
-18.67%
Classificazione dei paesi secondo i statistiche attuali per anni


Commenti: