29
/it/
it
AIzaSyAYiBZKx7MnpbEhh9jyipgxe19OcubqV5w
April 1, 2024
136249
Gabon
GAB
true
2
1
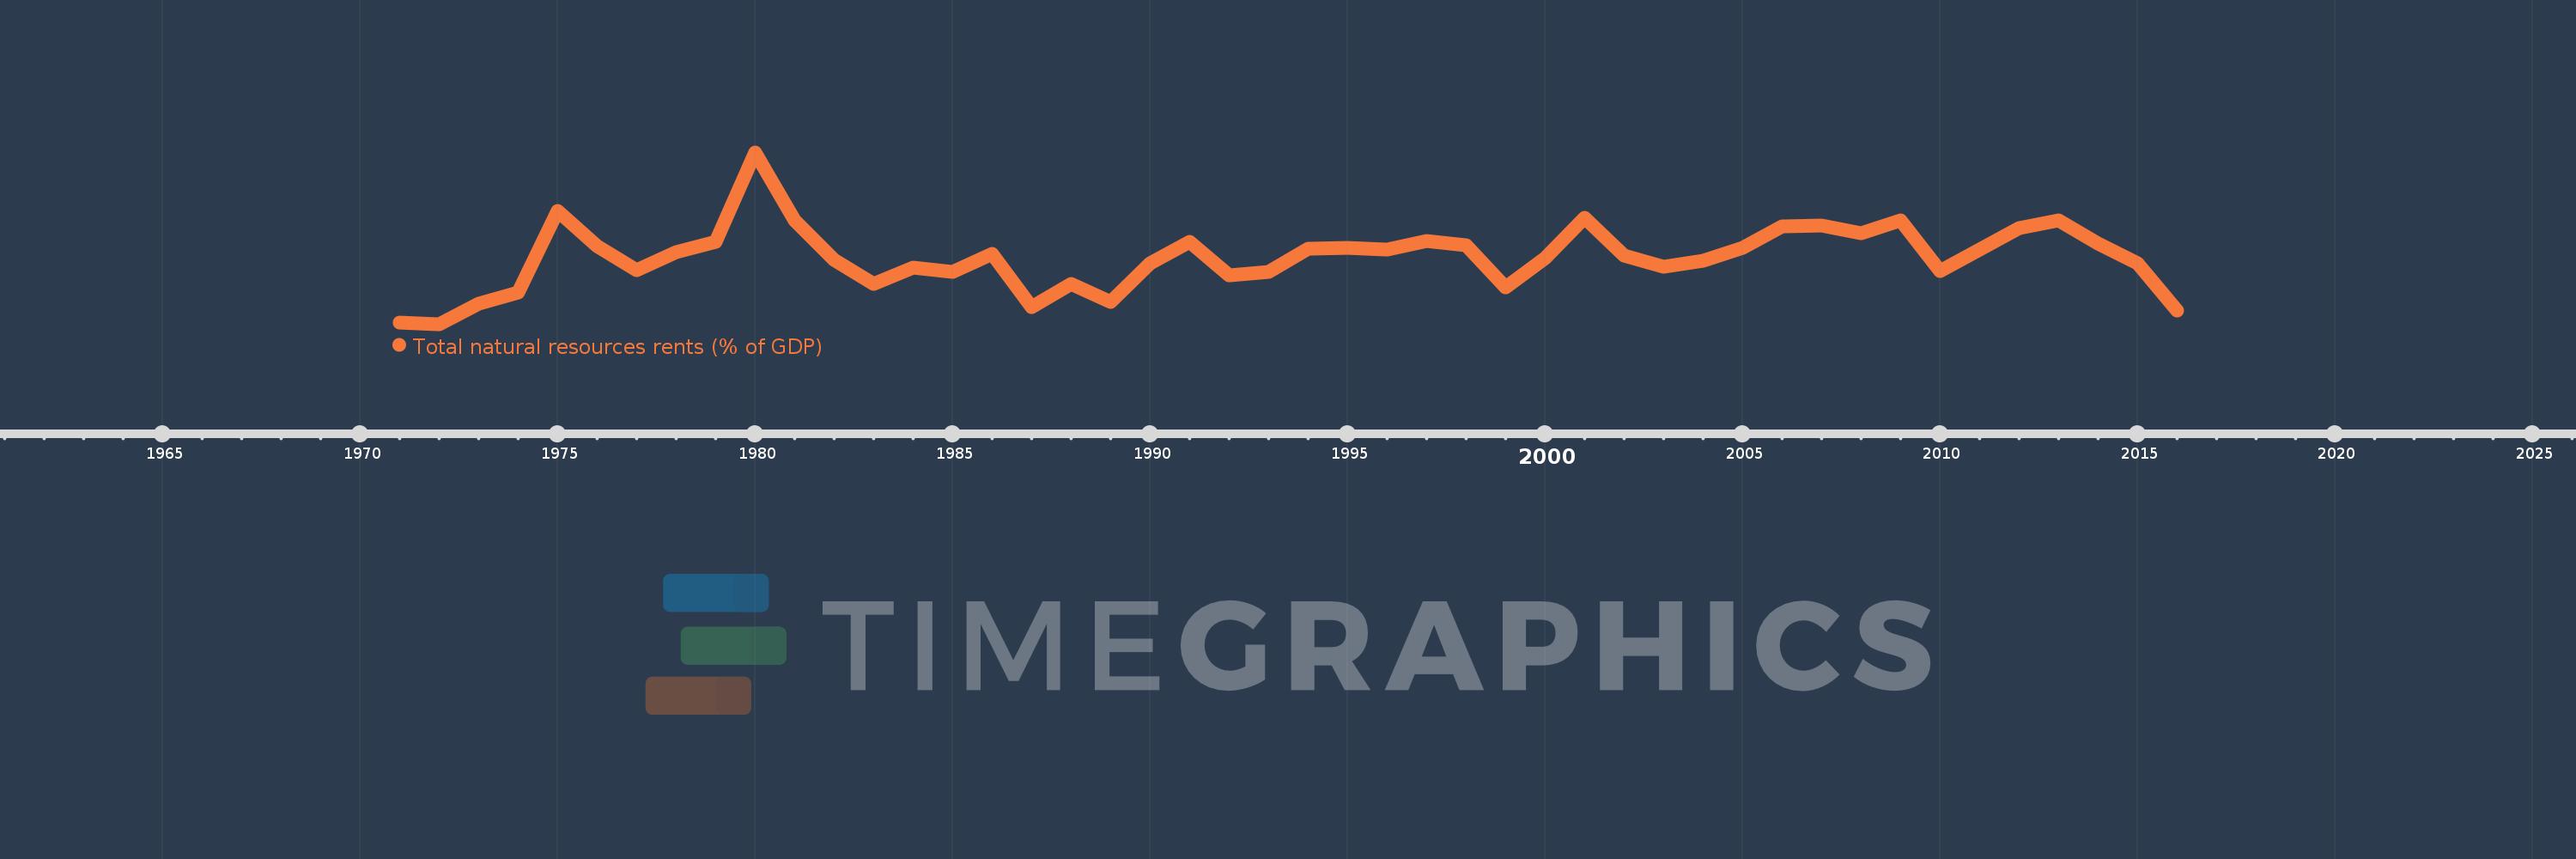
Total natural resources rents (% of GDP)
2016,2015,2014,2013,2012,2011,2010,2009,2008,2007,2006,2005,2004,2003,2002,2001,2000,1999,1998,1997,1996,1995,1994,1993,1992,1991,1990,1989,1988,1987,1986,1985,1984,1983,1982,1981,1980,1979,1978,1977,1976,1975,1974,1973,1972,1971
Queste statistiche in altri paesi:
AfghanistanAlbaniaAlgeriaAngolaArab WorldArgentinaArmeniaArubaAustraliaAustriaAzerbaijanBahamas, TheBahrainBangladeshBarbadosBelarusBelgiumBelizeBeninBhutanBoliviaBosnia and HerzegovinaBotswanaBrazilBrunei DarussalamBulgariaBurkina FasoBurundiCabo VerdeCambodiaCameroonCanadaCaribbean small statesCentral African RepublicCentral Europe and the BalticsChadChileChinaColombiaComorosCongo, Dem. Rep.Congo, Rep.Costa RicaCote d'IvoireCroatiaCubaCyprusCzech RepublicDenmarkDjiboutiDominicaDominican RepublicEarly-demographic dividendEast Asia & PacificEast Asia & Pacific (excluding high income)East Asia & Pacific (IDA & IBRD countries)EcuadorEgypt, Arab Rep.El SalvadorEquatorial GuineaEritreaEstoniaEthiopiaEuro areaEurope & Central AsiaEurope & Central Asia (excluding high income)Europe & Central Asia (IDA & IBRD countries)European UnionFijiFinlandFragile and conflict affected situationsFranceFrench PolynesiaGabonGambia, TheGeorgiaGermanyGhanaGreeceGuatemalaGuineaGuinea-BissauGuyanaHaitiHeavily indebted poor countries (HIPC)High incomeHondurasHong Kong SAR, ChinaHungaryIBRD onlyIcelandIDA & IBRD totalIDA blendIDA onlyIDA totalIndiaIndonesiaIran, Islamic Rep.IraqIrelandIsraelItalyJamaicaJapanJordanKazakhstanKenyaKiribatiKorea, Rep.KuwaitKyrgyz RepublicLao PDRLate-demographic dividendLatin America & Caribbean Latin America & Caribbean (excluding high income)Latin America & the Caribbean (IDA & IBRD countries)LatviaLeast developed countries: UN classificationLebanonLesothoLiberiaLibyaLithuaniaLow & middle incomeLow incomeLower middle incomeLuxembourgMacao SAR, ChinaMacedonia, FYRMadagascarMalawiMalaysiaMaldivesMaliMaltaMauritaniaMauritiusMexicoMiddle East & North AfricaMiddle East & North Africa (excluding high income)Middle East & North Africa (IDA & IBRD countries)Middle incomeMoldovaMongoliaMontenegroMoroccoMozambiqueMyanmarNamibiaNepalNetherlandsNew CaledoniaNew ZealandNicaraguaNigerNigeriaNorth AmericaNorwayOECD membersOmanOther small statesPacific island small statesPakistanPanamaPapua New GuineaParaguayPeruPhilippinesPolandPortugalPost-demographic dividendPre-demographic dividendQatarRomaniaRussian FederationRwandaSamoaSao Tome and PrincipeSaudi ArabiaSenegalSerbiaSeychellesSierra LeoneSingaporeSlovak RepublicSloveniaSmall statesSolomon IslandsSouth AfricaSouth AsiaSouth Asia (IDA & IBRD)South SudanSpainSri LankaSt. LuciaSt. Vincent and the GrenadinesSub-Saharan Africa Sub-Saharan Africa (excluding high income)Sub-Saharan Africa (IDA & IBRD countries)SudanSurinameSwazilandSwedenSwitzerlandSyrian Arab RepublicTajikistanTanzaniaThailandTimor-LesteTogoTongaTrinidad and TobagoTunisiaTurkeyTurkmenistanUgandaUkraineUnited Arab EmiratesUnited KingdomUnited StatesUpper middle incomeUruguayUzbekistanVanuatuVenezuela, RBVietnamWorldYemen, Rep.ZambiaZimbabwe Linea del tempo:
Questa scala temporale mostra un grafico dal 1971 anno al 2016 anno. Gabon. I dati fino ad 1970 anno non disponibili. Il numero di osservazioni attuali secondo i date: 46.
La fonte (nome):
Indicatori dello sviluppo mondiale
La fonte (organizzazione):
Estimates based on sources and methods described in "The Changing Wealth of Nations: Measuring Sustainable Development in the New Millennium" (World Bank, 2011).
Categorie:
Energy & Mining, Environment
sono stati aggiornati
23 apr 2017 anni
Indicatori delle variazioni dei valori per anni
Minima:
8.595
1 gen 1972 anni
Massimo:
65.965
1 gen 1980 anni
Alla data di osservazione
Valore
Variazione assoluta
La variazione rispetto al valore precedente
1 gen 1971 anni
9.155
+9.155
0.0%
1 gen 1972 anni
8.595
-0.559
-6.11%
1 gen 1973 anni
15.498
+6.903
80.31%
1 gen 1974 anni
19.106
+3.608
23.28%
1 gen 1975 anni
46.437
+27.331
143.05%
1 gen 1976 anni
34.537
-11.9
-25.63%
1 gen 1977 anni
26.639
-7.898
-22.87%
1 gen 1978 anni
32.638
+5.999
22.52%
1 gen 1979 anni
36.106
+3.467
10.62%
1 gen 1980 anni
65.965
+29.859
82.7%
1 gen 1981 anni
43.17
-22.794
-34.56%
1 gen 1982 anni
30.011
-13.159
-30.48%
1 gen 1983 anni
22.132
-7.879
-26.25%
1 gen 1984 anni
27.449
+5.317
24.02%
1 gen 1985 anni
26.182
-1.267
-4.61%
1 gen 1986 anni
32.109
+5.927
22.64%
1 gen 1987 anni
14.411
-17.698
-55.12%
1 gen 1988 anni
22.182
+7.77
53.92%
1 gen 1989 anni
15.979
-6.202
-27.96%
1 gen 1990 anni
28.836
+12.857
80.46%
1 gen 1991 anni
36.035
+7.199
24.97%
1 gen 1992 anni
25.037
-10.998
-30.52%
1 gen 1993 anni
26.103
+1.066
4.26%
1 gen 1994 anni
33.673
+7.571
29.0%
1 gen 1995 anni
34.216
+0.543
1.61%
1 gen 1996 anni
33.528
-0.688
-2.01%
1 gen 1997 anni
36.51
+2.982
8.89%
1 gen 1998 anni
34.881
-1.629
-4.46%
1 gen 1999 anni
20.913
-13.968
-40.05%
1 gen 2000 anni
30.527
+9.614
45.97%
1 gen 2001 anni
44.201
+13.674
44.79%
1 gen 2002 anni
31.612
-12.589
-28.48%
1 gen 2003 anni
27.787
-3.825
-12.1%
1 gen 2004 anni
29.663
+1.876
6.75%
1 gen 2005 anni
34.077
+4.414
14.88%
1 gen 2006 anni
41.221
+7.145
20.97%
1 gen 2007 anni
41.586
+0.365
0.89%
1 gen 2008 anni
39.007
-2.58
-6.2%
1 gen 2009 anni
43.226
+4.219
10.82%
1 gen 2010 anni
26.228
-16.997
-39.32%
1 gen 2011 anni
33.483
+7.255
27.66%
1 gen 2012 anni
40.748
+7.265
21.7%
1 gen 2013 anni
43.368
+2.621
6.43%
1 gen 2014 anni
35.666
-7.702
-17.76%
1 gen 2015 anni
28.843
-6.823
-19.13%
1 gen 2016 anni
13.118
-15.725
-54.52%
Classificazione dei paesi secondo i statistiche attuali per anni


Commenti: