29
/it/
it
AIzaSyAYiBZKx7MnpbEhh9jyipgxe19OcubqV5w
April 1, 2024
223018
Peru
PER
true
2
1
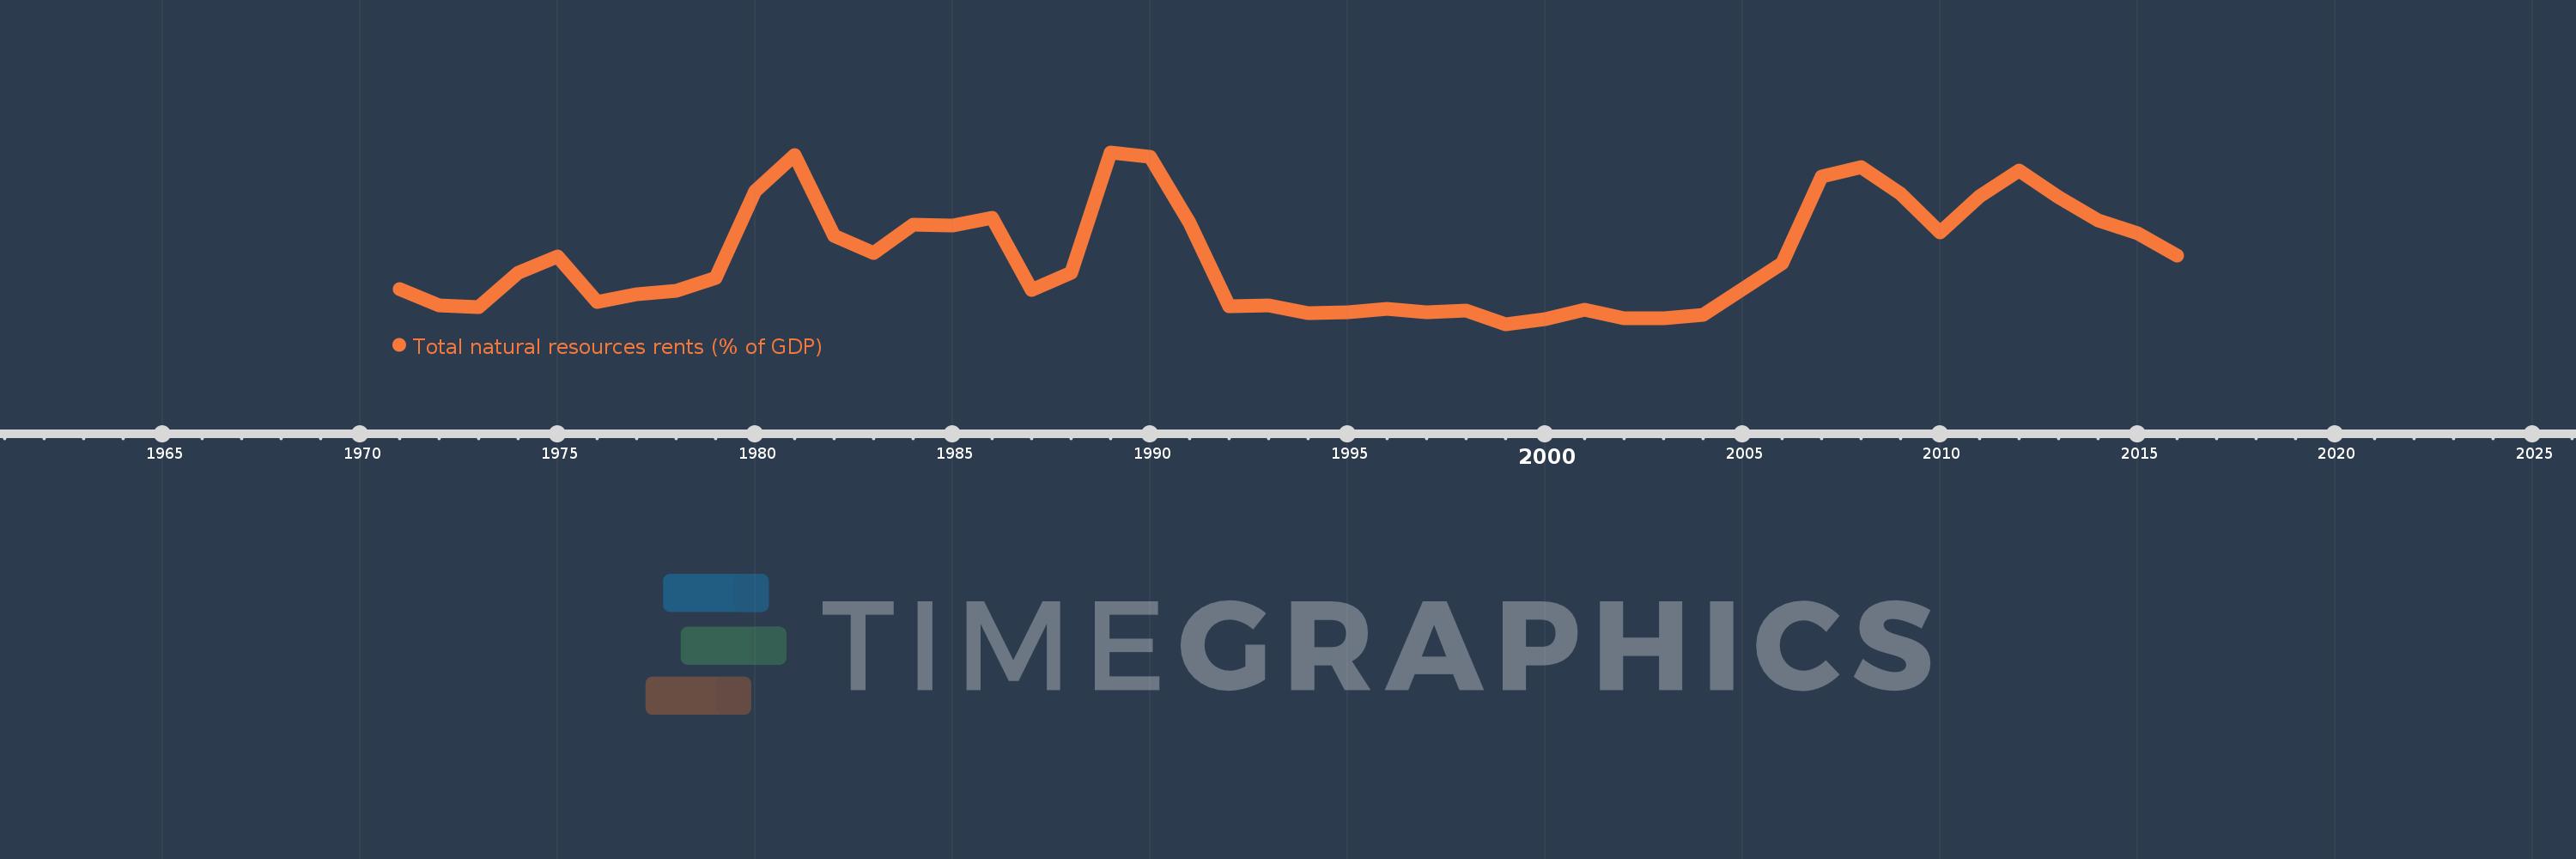
Total natural resources rents (% of GDP)
2016,2015,2014,2013,2012,2011,2010,2009,2008,2007,2006,2005,2004,2003,2002,2001,2000,1999,1998,1997,1996,1995,1994,1993,1992,1991,1990,1989,1988,1987,1986,1985,1984,1983,1982,1981,1980,1979,1978,1977,1976,1975,1974,1973,1972,1971
Queste statistiche in altri paesi:
AfghanistanAlbaniaAlgeriaAngolaArab WorldArgentinaArmeniaArubaAustraliaAustriaAzerbaijanBahamas, TheBahrainBangladeshBarbadosBelarusBelgiumBelizeBeninBhutanBoliviaBosnia and HerzegovinaBotswanaBrazilBrunei DarussalamBulgariaBurkina FasoBurundiCabo VerdeCambodiaCameroonCanadaCaribbean small statesCentral African RepublicCentral Europe and the BalticsChadChileChinaColombiaComorosCongo, Dem. Rep.Congo, Rep.Costa RicaCote d'IvoireCroatiaCubaCyprusCzech RepublicDenmarkDjiboutiDominicaDominican RepublicEarly-demographic dividendEast Asia & PacificEast Asia & Pacific (excluding high income)East Asia & Pacific (IDA & IBRD countries)EcuadorEgypt, Arab Rep.El SalvadorEquatorial GuineaEritreaEstoniaEthiopiaEuro areaEurope & Central AsiaEurope & Central Asia (excluding high income)Europe & Central Asia (IDA & IBRD countries)European UnionFijiFinlandFragile and conflict affected situationsFranceFrench PolynesiaGabonGambia, TheGeorgiaGermanyGhanaGreeceGuatemalaGuineaGuinea-BissauGuyanaHaitiHeavily indebted poor countries (HIPC)High incomeHondurasHong Kong SAR, ChinaHungaryIBRD onlyIcelandIDA & IBRD totalIDA blendIDA onlyIDA totalIndiaIndonesiaIran, Islamic Rep.IraqIrelandIsraelItalyJamaicaJapanJordanKazakhstanKenyaKiribatiKorea, Rep.KuwaitKyrgyz RepublicLao PDRLate-demographic dividendLatin America & Caribbean Latin America & Caribbean (excluding high income)Latin America & the Caribbean (IDA & IBRD countries)LatviaLeast developed countries: UN classificationLebanonLesothoLiberiaLibyaLithuaniaLow & middle incomeLow incomeLower middle incomeLuxembourgMacao SAR, ChinaMacedonia, FYRMadagascarMalawiMalaysiaMaldivesMaliMaltaMauritaniaMauritiusMexicoMiddle East & North AfricaMiddle East & North Africa (excluding high income)Middle East & North Africa (IDA & IBRD countries)Middle incomeMoldovaMongoliaMontenegroMoroccoMozambiqueMyanmarNamibiaNepalNetherlandsNew CaledoniaNew ZealandNicaraguaNigerNigeriaNorth AmericaNorwayOECD membersOmanOther small statesPacific island small statesPakistanPanamaPapua New GuineaParaguayPeruPhilippinesPolandPortugalPost-demographic dividendPre-demographic dividendQatarRomaniaRussian FederationRwandaSamoaSao Tome and PrincipeSaudi ArabiaSenegalSerbiaSeychellesSierra LeoneSingaporeSlovak RepublicSloveniaSmall statesSolomon IslandsSouth AfricaSouth AsiaSouth Asia (IDA & IBRD)South SudanSpainSri LankaSt. LuciaSt. Vincent and the GrenadinesSub-Saharan Africa Sub-Saharan Africa (excluding high income)Sub-Saharan Africa (IDA & IBRD countries)SudanSurinameSwazilandSwedenSwitzerlandSyrian Arab RepublicTajikistanTanzaniaThailandTimor-LesteTogoTongaTrinidad and TobagoTunisiaTurkeyTurkmenistanUgandaUkraineUnited Arab EmiratesUnited KingdomUnited StatesUpper middle incomeUruguayUzbekistanVanuatuVenezuela, RBVietnamWorldYemen, Rep.ZambiaZimbabwe Linea del tempo:
Questa scala temporale mostra un grafico dal 1971 anno al 2016 anno. Peru. I dati fino ad 1970 anno non disponibili. Il numero di osservazioni attuali secondo i date: 46.
La fonte (nome):
Indicatori dello sviluppo mondiale
La fonte (organizzazione):
Estimates based on sources and methods described in "The Changing Wealth of Nations: Measuring Sustainable Development in the New Millennium" (World Bank, 2011).
Categorie:
Energy & Mining, Environment
sono stati aggiornati
23 apr 2017 anni
Indicatori delle variazioni dei valori per anni
Minima:
0.695
1 gen 1999 anni
Massimo:
14.681
1 gen 1989 anni
Alla data di osservazione
Valore
Variazione assoluta
La variazione rispetto al valore precedente
1 gen 1971 anni
3.58
+3.58
0.0%
1 gen 1972 anni
2.193
-1.388
-38.76%
1 gen 1973 anni
2.101
-0.092
-4.18%
1 gen 1974 anni
4.863
+2.762
131.46%
1 gen 1975 anni
6.187
+1.323
27.21%
1 gen 1976 anni
2.484
-3.703
-59.85%
1 gen 1977 anni
3.133
+0.649
26.15%
1 gen 1978 anni
3.386
+0.253
8.06%
1 gen 1979 anni
4.493
+1.107
32.69%
1 gen 1980 anni
11.546
+7.053
157.0%
1 gen 1981 anni
14.48
+2.934
25.41%
1 gen 1982 anni
7.88
-6.6
-45.58%
1 gen 1983 anni
6.486
-1.394
-17.69%
1 gen 1984 anni
8.822
+2.336
36.02%
1 gen 1985 anni
8.748
-0.074
-0.84%
1 gen 1986 anni
9.364
+0.616
7.04%
1 gen 1987 anni
3.452
-5.912
-63.14%
1 gen 1988 anni
4.896
+1.444
41.83%
1 gen 1989 anni
14.681
+9.785
199.88%
1 gen 1990 anni
14.329
-0.352
-2.4%
1 gen 1991 anni
8.959
-5.37
-37.48%
1 gen 1992 anni
2.136
-6.823
-76.16%
1 gen 1993 anni
2.205
+0.069
3.25%
1 gen 1994 anni
1.62
-0.585
-26.53%
1 gen 1995 anni
1.659
+0.039
2.42%
1 gen 1996 anni
1.947
+0.288
17.37%
1 gen 1997 anni
1.673
-0.274
-14.08%
1 gen 1998 anni
1.79
+0.117
6.99%
1 gen 1999 anni
0.695
-1.095
-61.15%
1 gen 2000 anni
1.085
+0.39
56.02%
1 gen 2001 anni
1.899
+0.814
75.04%
1 gen 2002 anni
1.187
-0.712
-37.5%
1 gen 2003 anni
1.192
+0.005
0.45%
1 gen 2004 anni
1.49
+0.298
24.99%
1 gen 2005 anni
3.549
+2.059
138.16%
1 gen 2006 anni
5.673
+2.124
59.83%
1 gen 2007 anni
12.684
+7.011
123.58%
1 gen 2008 anni
13.501
+0.818
6.45%
1 gen 2009 anni
11.321
-2.18
-16.15%
1 gen 2010 anni
8.158
-3.163
-27.94%
1 gen 2011 anni
11.102
+2.944
36.09%
1 gen 2012 anni
13.176
+2.075
18.69%
1 gen 2013 anni
11.043
-2.134
-16.19%
1 gen 2014 anni
9.163
-1.88
-17.02%
1 gen 2015 anni
8.122
-1.041
-11.36%
1 gen 2016 anni
6.291
-1.831
-22.54%
Classificazione dei paesi secondo i statistiche attuali per anni


Commenti: