29
/it/
it
AIzaSyAYiBZKx7MnpbEhh9jyipgxe19OcubqV5w
April 1, 2024
236576
Senegal
SEN
true
2
1
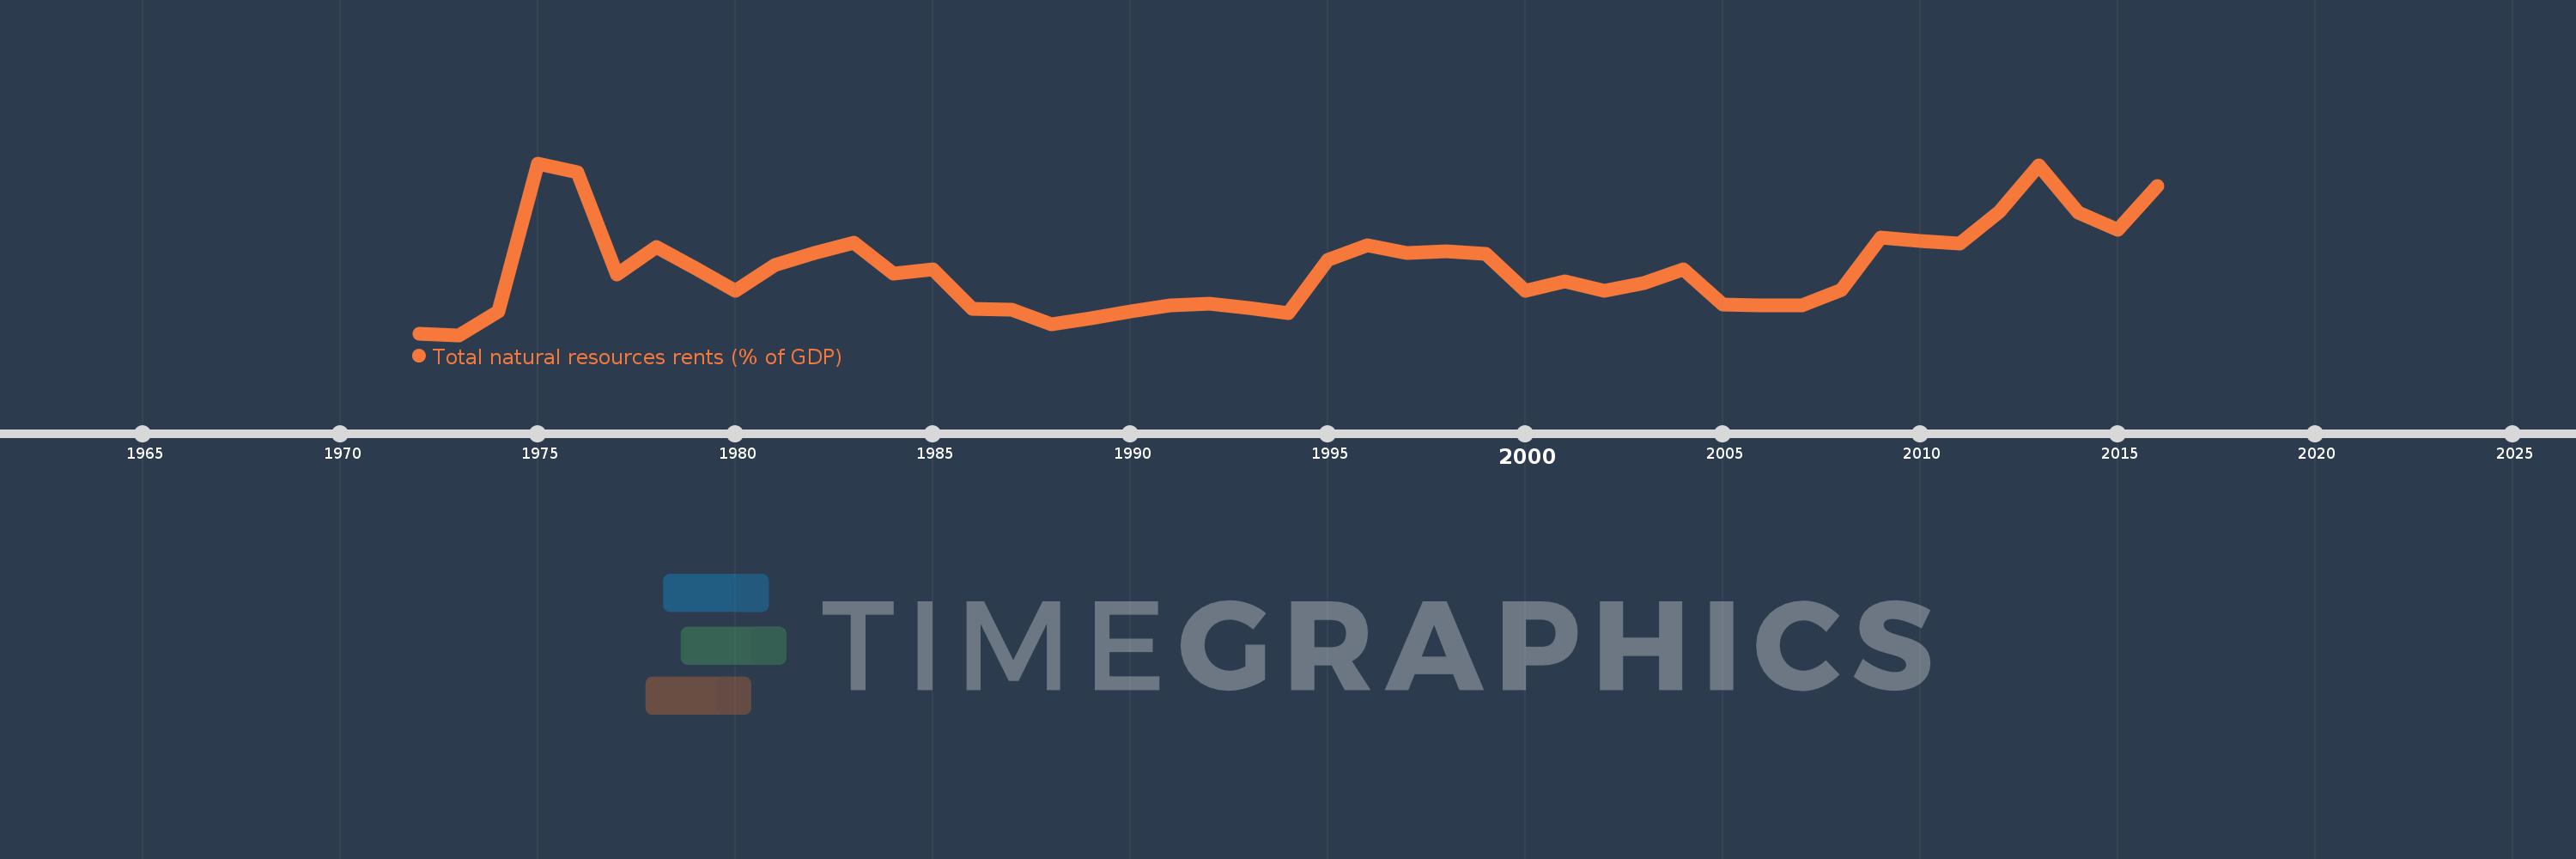
Total natural resources rents (% of GDP)
2016,2015,2014,2013,2012,2011,2010,2009,2008,2007,2006,2005,2004,2003,2002,2001,2000,1999,1998,1997,1996,1995,1994,1993,1992,1991,1990,1989,1988,1987,1986,1985,1984,1983,1982,1981,1980,1979,1978,1977,1976,1975,1974,1973,1972
Queste statistiche in altri paesi:
AfghanistanAlbaniaAlgeriaAngolaArab WorldArgentinaArmeniaArubaAustraliaAustriaAzerbaijanBahamas, TheBahrainBangladeshBarbadosBelarusBelgiumBelizeBeninBhutanBoliviaBosnia and HerzegovinaBotswanaBrazilBrunei DarussalamBulgariaBurkina FasoBurundiCabo VerdeCambodiaCameroonCanadaCaribbean small statesCentral African RepublicCentral Europe and the BalticsChadChileChinaColombiaComorosCongo, Dem. Rep.Congo, Rep.Costa RicaCote d'IvoireCroatiaCubaCyprusCzech RepublicDenmarkDjiboutiDominicaDominican RepublicEarly-demographic dividendEast Asia & PacificEast Asia & Pacific (excluding high income)East Asia & Pacific (IDA & IBRD countries)EcuadorEgypt, Arab Rep.El SalvadorEquatorial GuineaEritreaEstoniaEthiopiaEuro areaEurope & Central AsiaEurope & Central Asia (excluding high income)Europe & Central Asia (IDA & IBRD countries)European UnionFijiFinlandFragile and conflict affected situationsFranceFrench PolynesiaGabonGambia, TheGeorgiaGermanyGhanaGreeceGuatemalaGuineaGuinea-BissauGuyanaHaitiHeavily indebted poor countries (HIPC)High incomeHondurasHong Kong SAR, ChinaHungaryIBRD onlyIcelandIDA & IBRD totalIDA blendIDA onlyIDA totalIndiaIndonesiaIran, Islamic Rep.IraqIrelandIsraelItalyJamaicaJapanJordanKazakhstanKenyaKiribatiKorea, Rep.KuwaitKyrgyz RepublicLao PDRLate-demographic dividendLatin America & Caribbean Latin America & Caribbean (excluding high income)Latin America & the Caribbean (IDA & IBRD countries)LatviaLeast developed countries: UN classificationLebanonLesothoLiberiaLibyaLithuaniaLow & middle incomeLow incomeLower middle incomeLuxembourgMacao SAR, ChinaMacedonia, FYRMadagascarMalawiMalaysiaMaldivesMaliMaltaMauritaniaMauritiusMexicoMiddle East & North AfricaMiddle East & North Africa (excluding high income)Middle East & North Africa (IDA & IBRD countries)Middle incomeMoldovaMongoliaMontenegroMoroccoMozambiqueMyanmarNamibiaNepalNetherlandsNew CaledoniaNew ZealandNicaraguaNigerNigeriaNorth AmericaNorwayOECD membersOmanOther small statesPacific island small statesPakistanPanamaPapua New GuineaParaguayPeruPhilippinesPolandPortugalPost-demographic dividendPre-demographic dividendQatarRomaniaRussian FederationRwandaSamoaSao Tome and PrincipeSaudi ArabiaSenegalSerbiaSeychellesSierra LeoneSingaporeSlovak RepublicSloveniaSmall statesSolomon IslandsSouth AfricaSouth AsiaSouth Asia (IDA & IBRD)South SudanSpainSri LankaSt. LuciaSt. Vincent and the GrenadinesSub-Saharan Africa Sub-Saharan Africa (excluding high income)Sub-Saharan Africa (IDA & IBRD countries)SudanSurinameSwazilandSwedenSwitzerlandSyrian Arab RepublicTajikistanTanzaniaThailandTimor-LesteTogoTongaTrinidad and TobagoTunisiaTurkeyTurkmenistanUgandaUkraineUnited Arab EmiratesUnited KingdomUnited StatesUpper middle incomeUruguayUzbekistanVanuatuVenezuela, RBVietnamWorldYemen, Rep.ZambiaZimbabwe Linea del tempo:
Questa scala temporale mostra un grafico dal 1972 anno al 2016 anno. Senegal. I dati fino ad 1971 anno non disponibili. Il numero di osservazioni attuali secondo i date: 45.
La fonte (nome):
Indicatori dello sviluppo mondiale
La fonte (organizzazione):
Estimates based on sources and methods described in "The Changing Wealth of Nations: Measuring Sustainable Development in the New Millennium" (World Bank, 2011).
Categorie:
Energy & Mining, Environment
sono stati aggiornati
23 apr 2017 anni
Indicatori delle variazioni dei valori per anni
Minima:
1.603
1 gen 1973 anni
Massimo:
6.418
1 gen 1975 anni
Alla data di osservazione
Valore
Variazione assoluta
La variazione rispetto al valore precedente
1 gen 1972 anni
1.638
+1.638
0.0%
1 gen 1973 anni
1.603
-0.035
-2.13%
1 gen 1974 anni
2.273
+0.67
41.83%
1 gen 1975 anni
6.418
+4.145
182.32%
1 gen 1976 anni
6.176
-0.242
-3.77%
1 gen 1977 anni
3.3
-2.876
-46.57%
1 gen 1978 anni
4.08
+0.78
23.64%
1 gen 1979 anni
3.467
-0.613
-15.03%
1 gen 1980 anni
2.835
-0.631
-18.21%
1 gen 1981 anni
3.566
+0.73
25.75%
1 gen 1982 anni
3.902
+0.336
9.43%
1 gen 1983 anni
4.201
+0.299
7.66%
1 gen 1984 anni
3.313
-0.888
-21.13%
1 gen 1985 anni
3.453
+0.14
4.22%
1 gen 1986 anni
2.344
-1.109
-32.12%
1 gen 1987 anni
2.306
-0.038
-1.61%
1 gen 1988 anni
1.895
-0.411
-17.84%
1 gen 1989 anni
2.07
+0.175
9.24%
1 gen 1990 anni
2.276
+0.206
9.97%
1 gen 1991 anni
2.425
+0.149
6.56%
1 gen 1992 anni
2.475
+0.05
2.06%
1 gen 1993 anni
2.355
-0.121
-4.87%
1 gen 1994 anni
2.225
-0.13
-5.51%
1 gen 1995 anni
3.712
+1.487
66.84%
1 gen 1996 anni
4.121
+0.409
11.01%
1 gen 1997 anni
3.905
-0.216
-5.23%
1 gen 1998 anni
3.954
+0.048
1.24%
1 gen 1999 anni
3.87
-0.084
-2.12%
1 gen 2000 anni
2.841
-1.028
-26.58%
1 gen 2001 anni
3.109
+0.268
9.43%
1 gen 2002 anni
2.853
-0.257
-8.26%
1 gen 2003 anni
3.069
+0.216
7.59%
1 gen 2004 anni
3.444
+0.375
12.21%
1 gen 2005 anni
2.45
-0.994
-28.86%
1 gen 2006 anni
2.426
-0.024
-0.99%
1 gen 2007 anni
2.425
0.0
-0.01%
1 gen 2008 anni
2.871
+0.445
18.36%
1 gen 2009 anni
4.334
+1.464
50.99%
1 gen 2010 anni
4.231
-0.104
-2.39%
1 gen 2011 anni
4.162
-0.069
-1.63%
1 gen 2012 anni
5.049
+0.887
21.32%
1 gen 2013 anni
6.347
+1.297
25.69%
1 gen 2014 anni
5.034
-1.313
-20.69%
1 gen 2015 anni
4.544
-0.49
-9.72%
1 gen 2016 anni
5.789
+1.244
27.39%
Classificazione dei paesi secondo i statistiche attuali per anni


Commenti: