29
/fr/
fr
AIzaSyAYiBZKx7MnpbEhh9jyipgxe19OcubqV5w
April 1, 2024
97122
Cabo Verde
CPV
true
2
1
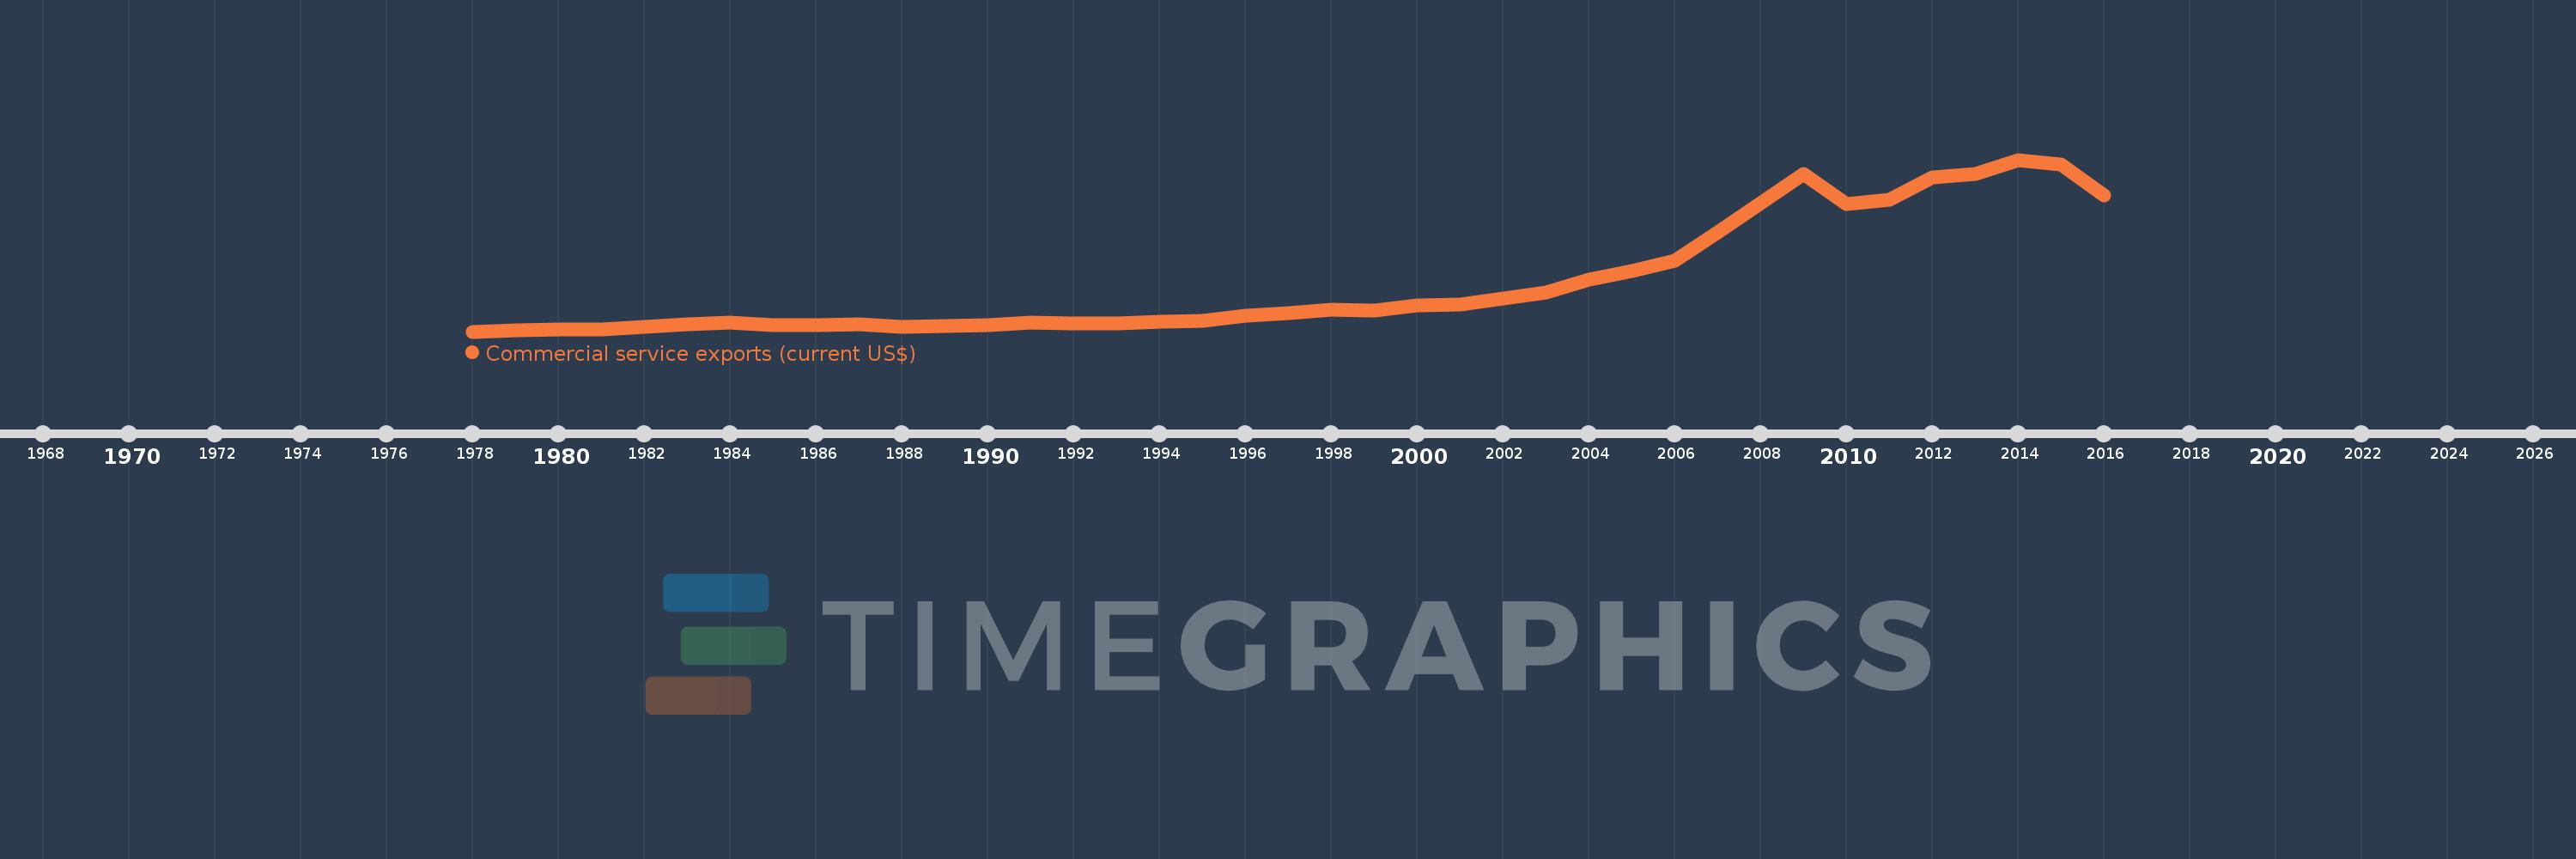
Commercial service exports (current US$)
2016,2015,2014,2013,2012,2011,2010,2009,2008,2007,2006,2005,2004,2003,2002,2001,2000,1999,1998,1997,1996,1995,1994,1993,1992,1991,1990,1989,1988,1987,1986,1985,1984,1983,1982,1981,1980,1979,1978
Cette statistique dans les autres pays:
AfghanistanAlbaniaAlgeriaAngolaAntigua and BarbudaArab WorldArgentinaArmeniaArubaAustraliaAustriaAzerbaijanBahamas, TheBahrainBangladeshBarbadosBelarusBelgiumBelizeBeninBermudaBhutanBoliviaBosnia and HerzegovinaBotswanaBrazilBrunei DarussalamBulgariaBurkina FasoBurundiCabo VerdeCambodiaCameroonCanadaCaribbean small statesCentral African RepublicCentral Europe and the BalticsChadChileChinaColombiaComorosCongo, Dem. Rep.Congo, Rep.Costa RicaCote d'IvoireCroatiaCuracaoCyprusCzech RepublicDenmarkDjiboutiDominicaDominican RepublicEarly-demographic dividendEast Asia & PacificEast Asia & Pacific (excluding high income)East Asia & Pacific (IDA & IBRD countries)EcuadorEgypt, Arab Rep.El SalvadorEquatorial GuineaEritreaEstoniaEthiopiaEuro areaEurope & Central AsiaEurope & Central Asia (excluding high income)Europe & Central Asia (IDA & IBRD countries)European UnionFaroe IslandsFijiFinlandFragile and conflict affected situationsFranceFrench PolynesiaGabonGambia, TheGeorgiaGermanyGhanaGreeceGrenadaGuatemalaGuineaGuinea-BissauGuyanaHaitiHeavily indebted poor countries (HIPC)High incomeHondurasHong Kong SAR, ChinaHungaryIBRD onlyIcelandIDA & IBRD totalIDA blendIDA onlyIDA totalIndiaIndonesiaIran, Islamic Rep.IraqIrelandIsraelItalyJamaicaJapanJordanKazakhstanKenyaKiribatiKorea, Rep.KosovoKuwaitKyrgyz RepublicLao PDRLate-demographic dividendLatin America & Caribbean Latin America & Caribbean (excluding high income)Latin America & the Caribbean (IDA & IBRD countries)LatviaLeast developed countries: UN classificationLebanonLesothoLiberiaLibyaLithuaniaLow & middle incomeLow incomeLower middle incomeLuxembourgMacao SAR, ChinaMacedonia, FYRMadagascarMalawiMalaysiaMaldivesMaliMaltaMarshall IslandsMauritaniaMauritiusMexicoMicronesia, Fed. Sts.Middle East & North Africa (excluding high income)Middle East & North Africa (IDA & IBRD countries)Middle incomeMoldovaMongoliaMontenegroMoroccoMozambiqueMyanmarNamibiaNepalNetherlandsNew CaledoniaNew ZealandNicaraguaNigerNigeriaNorth AmericaNorwayOECD membersOmanPacific island small statesPakistanPalauPanamaPapua New GuineaParaguayPeruPhilippinesPolandPortugalPost-demographic dividendPre-demographic dividendQatarRomaniaRussian FederationRwandaSamoaSao Tome and PrincipeSaudi ArabiaSenegalSerbiaSeychellesSierra LeoneSingaporeSint Maarten (Dutch part)Slovak RepublicSloveniaSolomon IslandsSouth AfricaSouth AsiaSouth Asia (IDA & IBRD)South SudanSpainSri LankaSt. Kitts and NevisSt. LuciaSt. Vincent and the GrenadinesSub-Saharan Africa Sub-Saharan Africa (excluding high income)Sub-Saharan Africa (IDA & IBRD countries)SudanSurinameSwazilandSwedenSwitzerlandSyrian Arab RepublicTajikistanTanzaniaThailandTimor-LesteTogoTongaTrinidad and TobagoTunisiaTurkeyTuvaluUgandaUkraineUnited KingdomUnited StatesUpper middle incomeUruguayVanuatuVenezuela, RBVietnamWest Bank and GazaWorldYemen, Rep.ZambiaZimbabwe La ligne de temps
Cette échelle de temps montre un graphique de 1978 année à 2016 année Cabo Verde. Les données jusqu'à 1977 année ne sont pas présentés. Quantité d'observations actuelles selon dates: 39.
Source (désignation):
Les indicateurs du développement mondiale
Source (organisation):
International Monetary Fund, Balance of Payments Statistics Yearbook and data files.
Catégories:
Private Sector, Trade
Dernière mise à jour
23 avr. 2017
Les indicateurs de changement de valeurs selon les années
Minimum:
957.514 milles
1 janv. 1978
Maximum:
633.672 mln.
1 janv. 2014
Pour la date d''observation
Valeur
Changement absolu
Le changement par rapport à la valeur précédente
1 janv. 1978
957.514 milles
+957.514 milles
0.0%
1 janv. 1979
4.682 mln.
+3.724 mln.
388.93%
1 janv. 1980
8.193 mln.
+3.512 mln.
75.01%
1 janv. 1981
10.078 mln.
+1.885 mln.
23.01%
1 janv. 1982
17.39 mln.
+7.312 mln.
72.55%
1 janv. 1983
27.454 mln.
+10.064 mln.
57.87%
1 janv. 1984
33.484 mln.
+6.029 mln.
21.96%
1 janv. 1985
23.734 mln.
-9.75 mln.
-29.12%
1 janv. 1986
24.815 mln.
+1.08 mln.
4.55%
1 janv. 1987
28.337 mln.
+3.523 mln.
14.2%
1 janv. 1988
19.632 mln.
-8.705 mln.
-30.72%
1 janv. 1989
22.712 mln.
+3.08 mln.
15.69%
1 janv. 1990
25.015 mln.
+2.302 mln.
10.14%
1 janv. 1991
33.677 mln.
+8.663 mln.
34.63%
1 janv. 1992
30.422 mln.
-3.256 mln.
-9.67%
1 janv. 1993
30.906 mln.
+484.46 milles
1.59%
1 janv. 1994
35.899 mln.
+4.993 mln.
16.16%
1 janv. 1995
41.373 mln.
+5.474 mln.
15.25%
1 janv. 1996
59.568 mln.
+18.195 mln.
43.98%
1 janv. 1997
70.373 mln.
+10.805 mln.
18.14%
1 janv. 1998
81.619 mln.
+11.245 mln.
15.98%
1 janv. 1999
79.978 mln.
-1.641 mln.
-2.01%
1 janv. 2000
98.894 mln.
+18.916 mln.
23.65%
1 janv. 2001
99.59 mln.
+695.826 milles
0.7%
1 janv. 2002
122.539 mln.
+22.95 mln.
23.04%
1 janv. 2003
146.201 mln.
+23.662 mln.
19.31%
1 janv. 2004
191.659 mln.
+45.458 mln.
31.09%
1 janv. 2005
224.212 mln.
+32.552 mln.
16.98%
1 janv. 2006
260.492 mln.
+36.28 mln.
16.18%
1 janv. 2007
365.567 mln.
+105.076 mln.
40.34%
1 janv. 2008
473.703 mln.
+108.136 mln.
29.58%
1 janv. 2009
581.029 mln.
+107.326 mln.
22.66%
1 janv. 2010
472.234 mln.
-108.795 mln.
-18.72%
1 janv. 2011
487.326 mln.
+15.092 mln.
3.2%
1 janv. 2012
568.949 mln.
+81.623 mln.
16.75%
1 janv. 2013
581.04 mln.
+12.091 mln.
2.13%
1 janv. 2014
633.672 mln.
+52.632 mln.
9.06%
1 janv. 2015
615.35 mln.
-18.322 mln.
-2.89%
1 janv. 2016
503.752 mln.
-111.598 mln.
-18.14%
Classement des pays selon les statistiques actuelles par années


Commentaires: