29
/fr/
fr
AIzaSyAYiBZKx7MnpbEhh9jyipgxe19OcubqV5w
April 1, 2024
187559
Malaysia
MYS
true
2
1
Commercial service exports (current US$)
2016,2015,2014,2013,2012,2011,2010,2009,2008,2007,2006,2005,2004,2003,2002,2001,2000,1999,1998,1997,1996,1995,1994,1993,1992,1991,1990,1989,1988,1987,1986,1985,1984,1983,1982,1981,1980,1979,1978,1977,1976,1975
Cette statistique dans les autres pays:
AfghanistanAlbaniaAlgeriaAngolaAntigua and BarbudaArab WorldArgentinaArmeniaArubaAustraliaAustriaAzerbaijanBahamas, TheBahrainBangladeshBarbadosBelarusBelgiumBelizeBeninBermudaBhutanBoliviaBosnia and HerzegovinaBotswanaBrazilBrunei DarussalamBulgariaBurkina FasoBurundiCabo VerdeCambodiaCameroonCanadaCaribbean small statesCentral African RepublicCentral Europe and the BalticsChadChileChinaColombiaComorosCongo, Dem. Rep.Congo, Rep.Costa RicaCote d'IvoireCroatiaCuracaoCyprusCzech RepublicDenmarkDjiboutiDominicaDominican RepublicEarly-demographic dividendEast Asia & PacificEast Asia & Pacific (excluding high income)East Asia & Pacific (IDA & IBRD countries)EcuadorEgypt, Arab Rep.El SalvadorEquatorial GuineaEritreaEstoniaEthiopiaEuro areaEurope & Central AsiaEurope & Central Asia (excluding high income)Europe & Central Asia (IDA & IBRD countries)European UnionFaroe IslandsFijiFinlandFragile and conflict affected situationsFranceFrench PolynesiaGabonGambia, TheGeorgiaGermanyGhanaGreeceGrenadaGuatemalaGuineaGuinea-BissauGuyanaHaitiHeavily indebted poor countries (HIPC)High incomeHondurasHong Kong SAR, ChinaHungaryIBRD onlyIcelandIDA & IBRD totalIDA blendIDA onlyIDA totalIndiaIndonesiaIran, Islamic Rep.IraqIrelandIsraelItalyJamaicaJapanJordanKazakhstanKenyaKiribatiKorea, Rep.KosovoKuwaitKyrgyz RepublicLao PDRLate-demographic dividendLatin America & Caribbean Latin America & Caribbean (excluding high income)Latin America & the Caribbean (IDA & IBRD countries)LatviaLeast developed countries: UN classificationLebanonLesothoLiberiaLibyaLithuaniaLow & middle incomeLow incomeLower middle incomeLuxembourgMacao SAR, ChinaMacedonia, FYRMadagascarMalawiMalaysiaMaldivesMaliMaltaMarshall IslandsMauritaniaMauritiusMexicoMicronesia, Fed. Sts.Middle East & North Africa (excluding high income)Middle East & North Africa (IDA & IBRD countries)Middle incomeMoldovaMongoliaMontenegroMoroccoMozambiqueMyanmarNamibiaNepalNetherlandsNew CaledoniaNew ZealandNicaraguaNigerNigeriaNorth AmericaNorwayOECD membersOmanPacific island small statesPakistanPalauPanamaPapua New GuineaParaguayPeruPhilippinesPolandPortugalPost-demographic dividendPre-demographic dividendQatarRomaniaRussian FederationRwandaSamoaSao Tome and PrincipeSaudi ArabiaSenegalSerbiaSeychellesSierra LeoneSingaporeSint Maarten (Dutch part)Slovak RepublicSloveniaSolomon IslandsSouth AfricaSouth AsiaSouth Asia (IDA & IBRD)South SudanSpainSri LankaSt. Kitts and NevisSt. LuciaSt. Vincent and the GrenadinesSub-Saharan Africa Sub-Saharan Africa (excluding high income)Sub-Saharan Africa (IDA & IBRD countries)SudanSurinameSwazilandSwedenSwitzerlandSyrian Arab RepublicTajikistanTanzaniaThailandTimor-LesteTogoTongaTrinidad and TobagoTunisiaTurkeyTuvaluUgandaUkraineUnited KingdomUnited StatesUpper middle incomeUruguayVanuatuVenezuela, RBVietnamWest Bank and GazaWorldYemen, Rep.ZambiaZimbabwe La ligne de temps
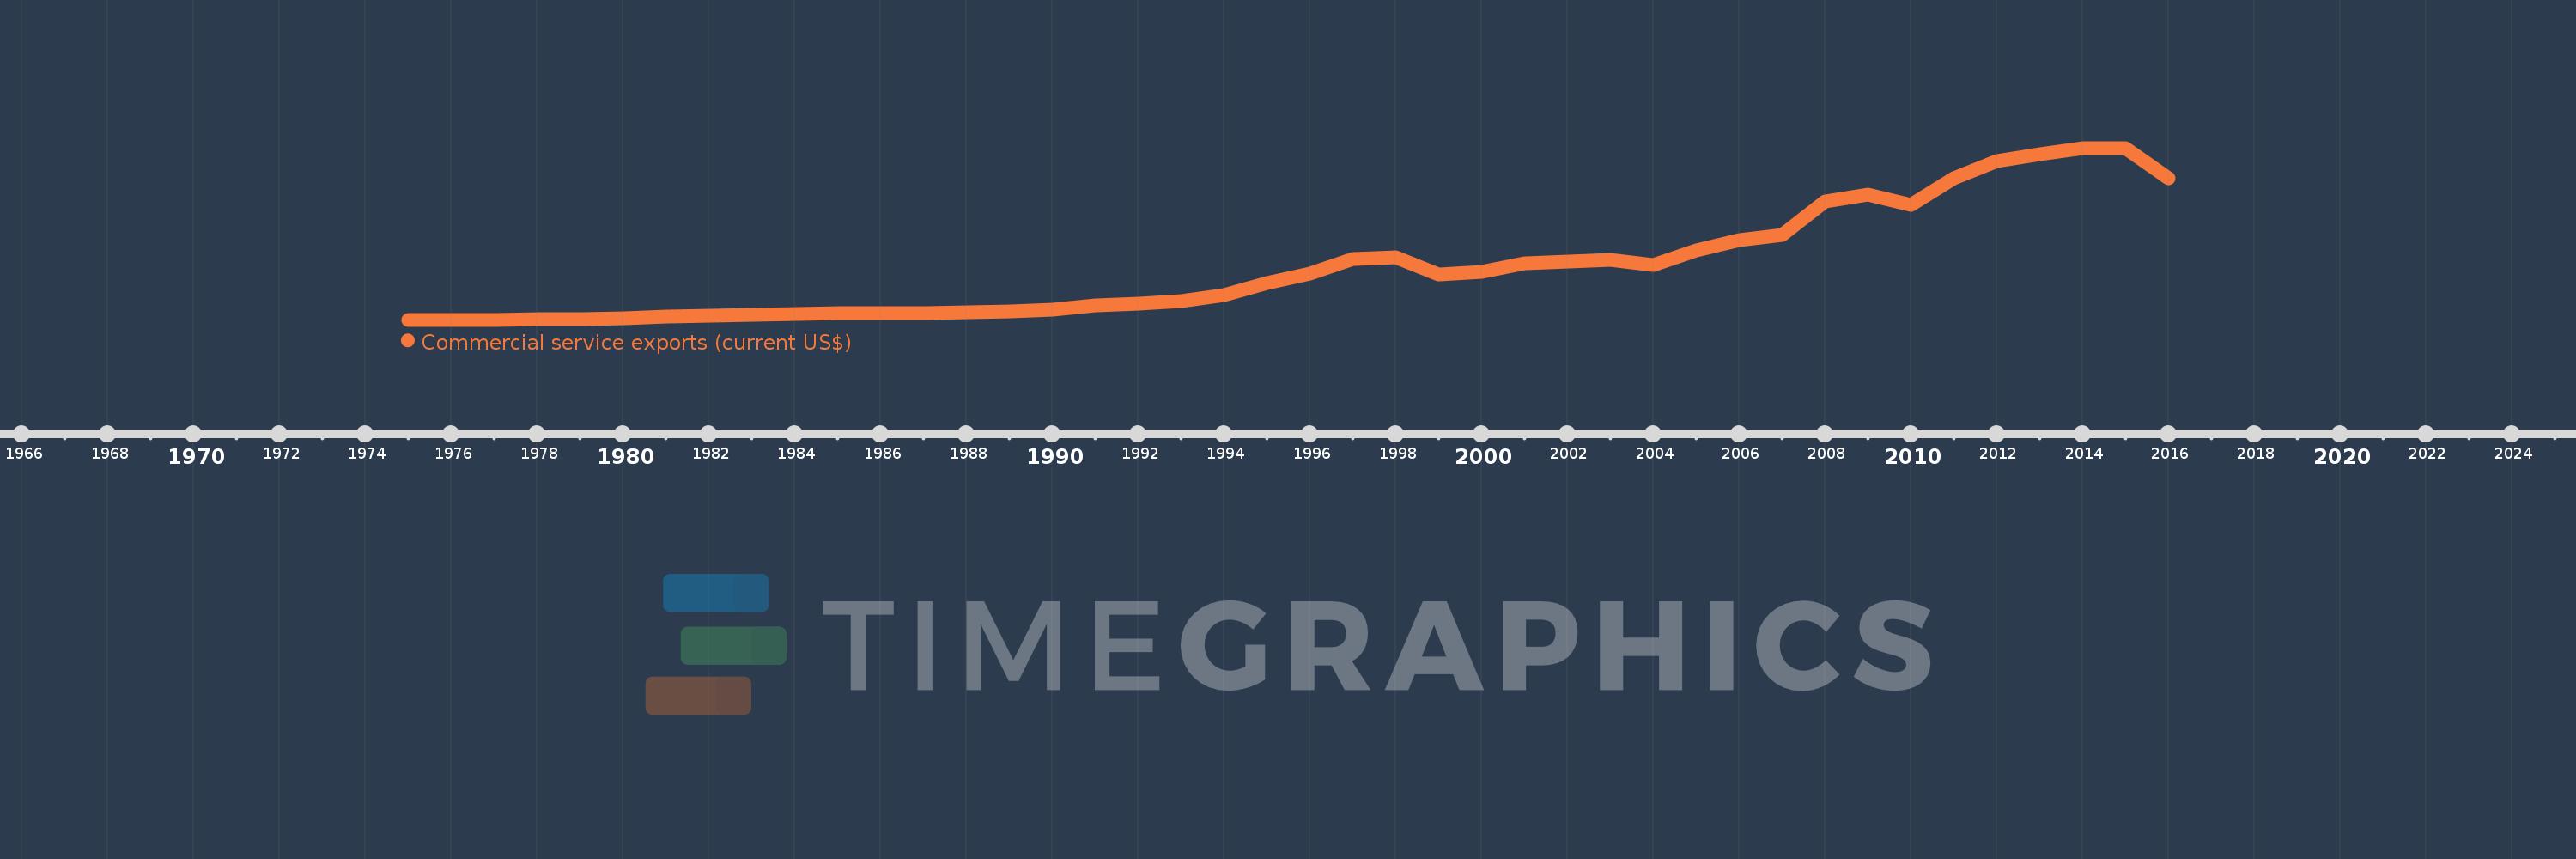
Cette échelle de temps montre un graphique de 1975 année à 2016 année Malaysia. Les données jusqu'à 1974 année ne sont pas présentés. Quantité d'observations actuelles selon dates: 42.
Source (désignation):
Les indicateurs du développement mondiale
Source (organisation):
International Monetary Fund, Balance of Payments Statistics Yearbook and data files.
Catégories:
Private Sector, Trade
Dernière mise à jour
23 avr. 2017
Les indicateurs de changement de valeurs selon les années
Minimum:
319.891 mln.
1 janv. 1975
Maximum:
42.005 mds
1 janv. 2014
Pour la date d''observation
Valeur
Changement absolu
Le changement par rapport à la valeur précédente
1 janv. 1975
319.891 mln.
+319.891 mln.
0.0%
1 janv. 1976
346.731 mln.
+26.84 mln.
8.39%
1 janv. 1977
337.192 mln.
-9.539 mln.
-2.75%
1 janv. 1978
424.169 mln.
+86.976 mln.
25.79%
1 janv. 1979
552.235 mln.
+128.066 mln.
30.19%
1 janv. 1980
705.982 mln.
+153.746 mln.
27.84%
1 janv. 1981
1.046 mds
+340.468 mln.
48.23%
1 janv. 1982
1.224 mds
+177.876 mln.
17.0%
1 janv. 1983
1.478 mds
+253.799 mln.
20.73%
1 janv. 1984
1.743 mds
+265.333 mln.
17.95%
1 janv. 1985
1.825 mds
+81.054 mln.
4.65%
1 janv. 1986
1.834 mds
+9.933 mln.
0.54%
1 janv. 1987
1.898 mds
+63.333 mln.
3.45%
1 janv. 1988
2.171 mds
+272.773 mln.
14.37%
1 janv. 1989
2.282 mds
+111.426 mln.
5.13%
1 janv. 1990
2.779 mds
+496.703 mln.
21.77%
1 janv. 1991
3.769 mds
+990.812 mln.
35.66%
1 janv. 1992
4.285 mds
+515.497 mln.
13.68%
1 janv. 1993
4.88 mds
+595.315 mln.
13.89%
1 janv. 1994
6.294 mds
+1.414 mds
28.97%
1 janv. 1995
9.2 mds
+2.905 mds
46.16%
1 janv. 1996
11.438 mds
+2.239 mds
24.33%
1 janv. 1997
14.966 mds
+3.528 mds
30.84%
1 janv. 1998
15.569 mds
+602.633 mln.
4.03%
1 janv. 1999
11.4 mds
-4.169 mds
-26.77%
1 janv. 2000
11.974 mds
+573.371 mln.
5.03%
1 janv. 2001
13.917 mds
+1.944 mds
16.23%
1 janv. 2002
14.447 mds
+529.684 mln.
3.81%
1 janv. 2003
14.793 mds
+346.658 mln.
2.4%
1 janv. 2004
13.521 mds
-1.272 mds
-8.6%
1 janv. 2005
17.199 mds
+3.678 mds
27.2%
1 janv. 2006
19.637 mds
+2.438 mds
14.17%
1 janv. 2007
20.971 mds
+1.334 mds
6.79%
1 janv. 2008
28.988 mds
+8.017 mds
38.23%
1 janv. 2009
30.714 mds
+1.725 mds
5.95%
1 janv. 2010
28.249 mds
-2.464 mds
-8.02%
1 janv. 2011
34.588 mds
+6.339 mds
22.44%
1 janv. 2012
38.752 mds
+4.163 mds
12.04%
1 janv. 2013
40.498 mds
+1.746 mds
4.51%
1 janv. 2014
42.005 mds
+1.507 mds
3.72%
1 janv. 2015
41.972 mds
-32.898 mln.
-0.08%
1 janv. 2016
34.582 mds
-7.39 mds
-17.61%
Classement des pays selon les statistiques actuelles par années


Commentaires: