29
/fr/
fr
AIzaSyAYiBZKx7MnpbEhh9jyipgxe19OcubqV5w
April 1, 2024
76005
Bahamas, The
BHS
true
2
1
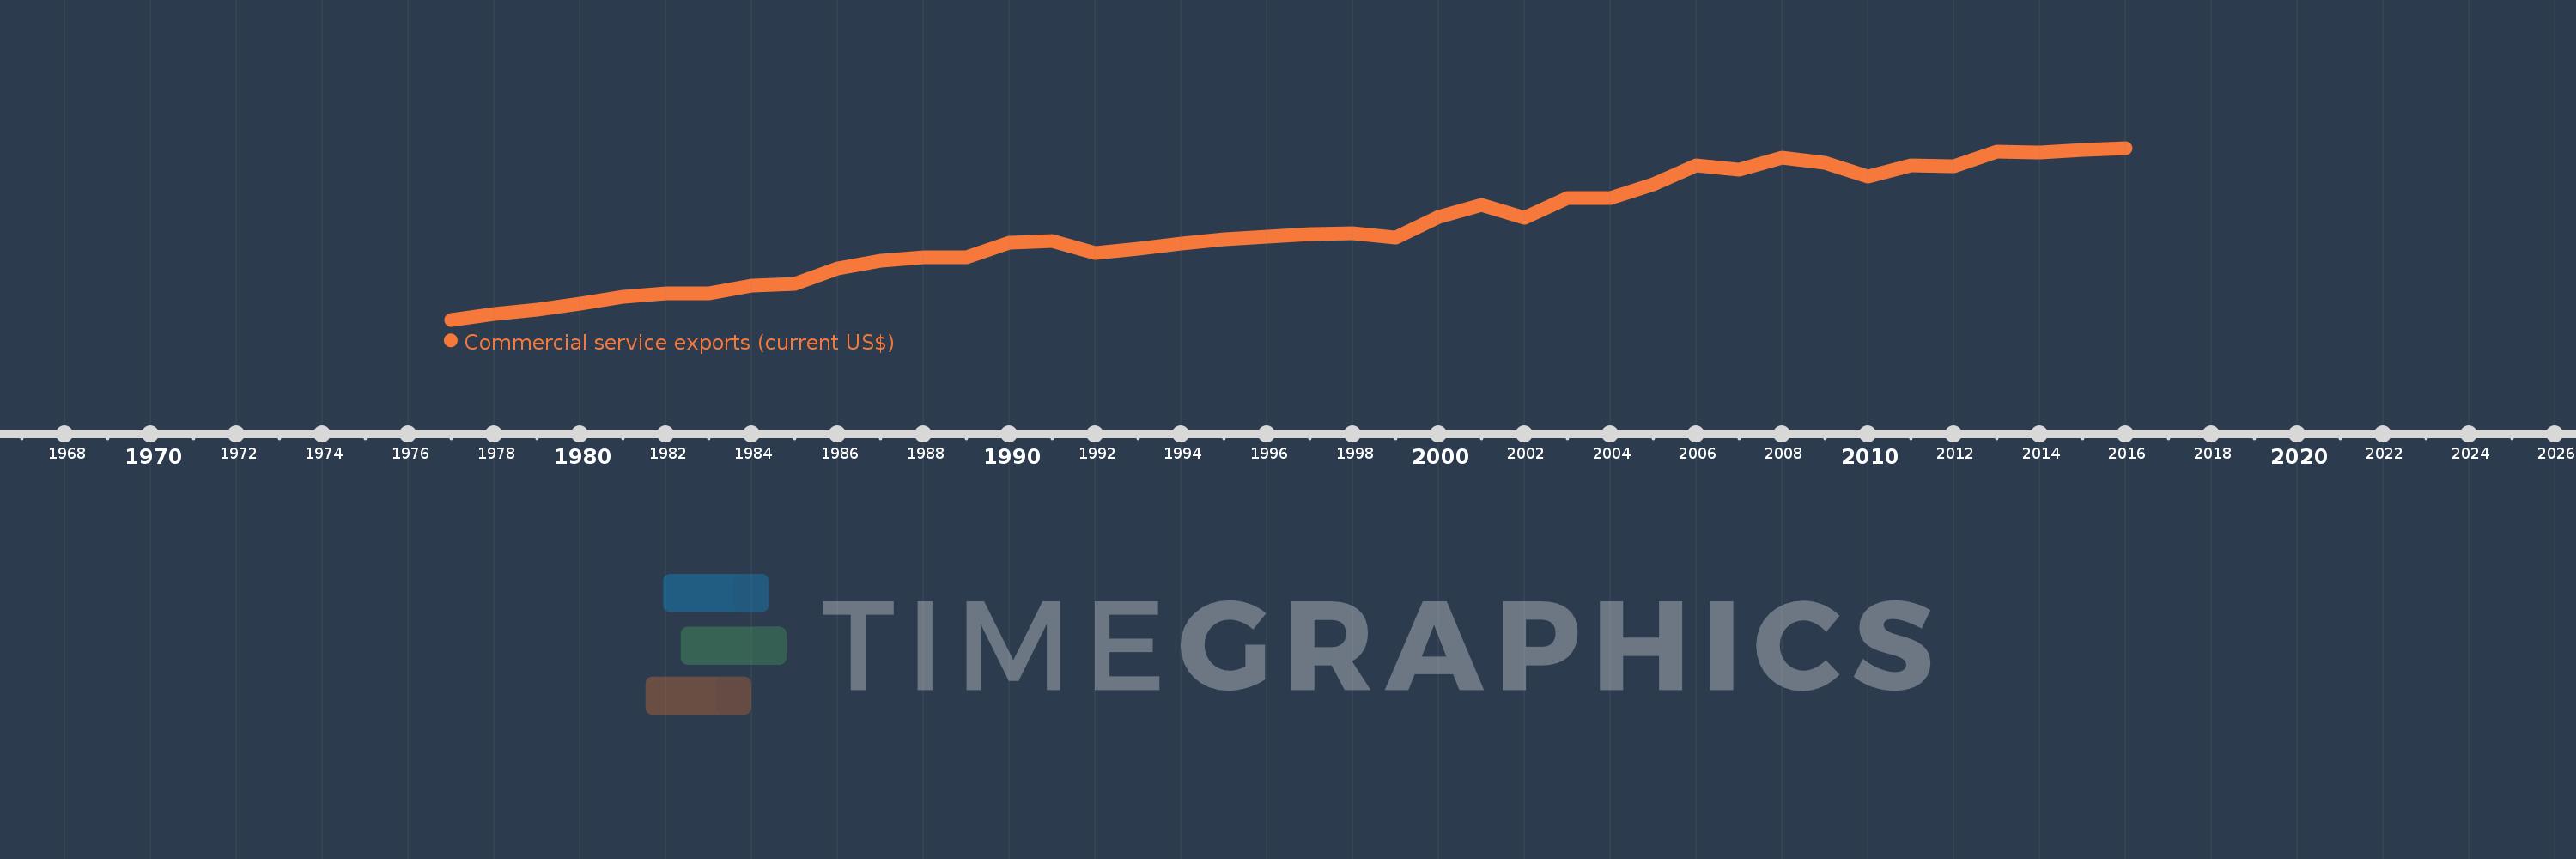
Commercial service exports (current US$)
2016,2015,2014,2013,2012,2011,2010,2009,2008,2007,2006,2005,2004,2003,2002,2001,2000,1999,1998,1997,1996,1995,1994,1993,1992,1991,1990,1989,1988,1987,1986,1985,1984,1983,1982,1981,1980,1979,1978,1977
Cette statistique dans les autres pays:
AfghanistanAlbaniaAlgeriaAngolaAntigua and BarbudaArab WorldArgentinaArmeniaArubaAustraliaAustriaAzerbaijanBahamas, TheBahrainBangladeshBarbadosBelarusBelgiumBelizeBeninBermudaBhutanBoliviaBosnia and HerzegovinaBotswanaBrazilBrunei DarussalamBulgariaBurkina FasoBurundiCabo VerdeCambodiaCameroonCanadaCaribbean small statesCentral African RepublicCentral Europe and the BalticsChadChileChinaColombiaComorosCongo, Dem. Rep.Congo, Rep.Costa RicaCote d'IvoireCroatiaCuracaoCyprusCzech RepublicDenmarkDjiboutiDominicaDominican RepublicEarly-demographic dividendEast Asia & PacificEast Asia & Pacific (excluding high income)East Asia & Pacific (IDA & IBRD countries)EcuadorEgypt, Arab Rep.El SalvadorEquatorial GuineaEritreaEstoniaEthiopiaEuro areaEurope & Central AsiaEurope & Central Asia (excluding high income)Europe & Central Asia (IDA & IBRD countries)European UnionFaroe IslandsFijiFinlandFragile and conflict affected situationsFranceFrench PolynesiaGabonGambia, TheGeorgiaGermanyGhanaGreeceGrenadaGuatemalaGuineaGuinea-BissauGuyanaHaitiHeavily indebted poor countries (HIPC)High incomeHondurasHong Kong SAR, ChinaHungaryIBRD onlyIcelandIDA & IBRD totalIDA blendIDA onlyIDA totalIndiaIndonesiaIran, Islamic Rep.IraqIrelandIsraelItalyJamaicaJapanJordanKazakhstanKenyaKiribatiKorea, Rep.KosovoKuwaitKyrgyz RepublicLao PDRLate-demographic dividendLatin America & Caribbean Latin America & Caribbean (excluding high income)Latin America & the Caribbean (IDA & IBRD countries)LatviaLeast developed countries: UN classificationLebanonLesothoLiberiaLibyaLithuaniaLow & middle incomeLow incomeLower middle incomeLuxembourgMacao SAR, ChinaMacedonia, FYRMadagascarMalawiMalaysiaMaldivesMaliMaltaMarshall IslandsMauritaniaMauritiusMexicoMicronesia, Fed. Sts.Middle East & North Africa (excluding high income)Middle East & North Africa (IDA & IBRD countries)Middle incomeMoldovaMongoliaMontenegroMoroccoMozambiqueMyanmarNamibiaNepalNetherlandsNew CaledoniaNew ZealandNicaraguaNigerNigeriaNorth AmericaNorwayOECD membersOmanPacific island small statesPakistanPalauPanamaPapua New GuineaParaguayPeruPhilippinesPolandPortugalPost-demographic dividendPre-demographic dividendQatarRomaniaRussian FederationRwandaSamoaSao Tome and PrincipeSaudi ArabiaSenegalSerbiaSeychellesSierra LeoneSingaporeSint Maarten (Dutch part)Slovak RepublicSloveniaSolomon IslandsSouth AfricaSouth AsiaSouth Asia (IDA & IBRD)South SudanSpainSri LankaSt. Kitts and NevisSt. LuciaSt. Vincent and the GrenadinesSub-Saharan Africa Sub-Saharan Africa (excluding high income)Sub-Saharan Africa (IDA & IBRD countries)SudanSurinameSwazilandSwedenSwitzerlandSyrian Arab RepublicTajikistanTanzaniaThailandTimor-LesteTogoTongaTrinidad and TobagoTunisiaTurkeyTuvaluUgandaUkraineUnited KingdomUnited StatesUpper middle incomeUruguayVanuatuVenezuela, RBVietnamWest Bank and GazaWorldYemen, Rep.ZambiaZimbabwe La ligne de temps
Cette échelle de temps montre un graphique de 1977 année à 2016 année Bahamas, The. Les données jusqu'à 1976 année ne sont pas présentés. Quantité d'observations actuelles selon dates: 40.
Source (désignation):
Les indicateurs du développement mondiale
Source (organisation):
International Monetary Fund, Balance of Payments Statistics Yearbook and data files.
Catégories:
Private Sector, Trade
Dernière mise à jour
23 avr. 2017
Les indicateurs de changement de valeurs selon les années
Minimum:
428.7 mln.
1 janv. 1977
Maximum:
2.691 mds
1 janv. 2016
Pour la date d''observation
Valeur
Changement absolu
Le changement par rapport à la valeur précédente
1 janv. 1977
428.7 mln.
+428.7 mln.
0.0%
1 janv. 1978
506.4 mln.
+77.7 mln.
18.12%
1 janv. 1979
565.2 mln.
+58.8 mln.
11.61%
1 janv. 1980
642.0 mln.
+76.8 mln.
13.59%
1 janv. 1981
731.0 mln.
+89.0 mln.
13.86%
1 janv. 1982
774.0 mln.
+43.0 mln.
5.88%
1 janv. 1983
774.6 mln.
+600.0 milles
0.08%
1 janv. 1984
875.2 mln.
+100.6 mln.
12.99%
1 janv. 1985
899.3 mln.
+24.1 mln.
2.75%
1 janv. 1986
1.104 mds
+204.5 mln.
22.74%
1 janv. 1987
1.205 mds
+100.9 mln.
9.14%
1 janv. 1988
1.248 mds
+42.8 mln.
3.55%
1 janv. 1989
1.257 mds
+9.1 mln.
0.73%
1 janv. 1990
1.442 mds
+185.4 mln.
14.75%
1 janv. 1991
1.465 mds
+23.1 mln.
1.6%
1 janv. 1992
1.313 mds
-152.0 mln.
-10.37%
1 janv. 1993
1.361 mds
+48.1 mln.
3.66%
1 janv. 1994
1.434 mds
+72.6 mln.
5.33%
1 janv. 1995
1.49 mds
+56.1 mln.
3.91%
1 janv. 1996
1.523 mds
+32.7 mln.
2.19%
1 janv. 1997
1.558 mds
+35.7 mln.
2.34%
1 janv. 1998
1.573 mds
+14.8 mln.
0.95%
1 janv. 1999
1.517 mds
-56.4 mln.
-3.59%
1 janv. 2000
1.778 mds
+261.2 mln.
17.22%
1 janv. 2001
1.946 mds
+167.9 mln.
9.44%
1 janv. 2002
1.776 mds
-169.7 mln.
-8.72%
1 janv. 2003
2.035 mds
+259.378 mln.
14.6%
1 janv. 2004
2.028 mds
-7.308 mln.
-0.36%
1 janv. 2005
2.211 mds
+182.62 mln.
9.0%
1 janv. 2006
2.46 mds
+248.936 mln.
11.26%
1 janv. 2007
2.403 mds
-56.536 mln.
-2.3%
1 janv. 2008
2.566 mds
+163.27 mln.
6.79%
1 janv. 2009
2.493 mds
-73.095 mln.
-2.85%
1 janv. 2010
2.311 mds
-182.128 mln.
-7.3%
1 janv. 2011
2.456 mds
+144.936 mln.
6.27%
1 janv. 2012
2.446 mds
-10.496 mln.
-0.43%
1 janv. 2013
2.648 mds
+202.208 mln.
8.27%
1 janv. 2014
2.631 mds
-17.205 mln.
-0.65%
1 janv. 2015
2.671 mds
+40.399 mln.
1.54%
1 janv. 2016
2.691 mds
+20.412 mln.
0.76%
Classement des pays selon les statistiques actuelles par années


Commentaires: