29
/fr/
fr
AIzaSyAYiBZKx7MnpbEhh9jyipgxe19OcubqV5w
April 1, 2024
248456
Sri Lanka
LKA
true
2
1
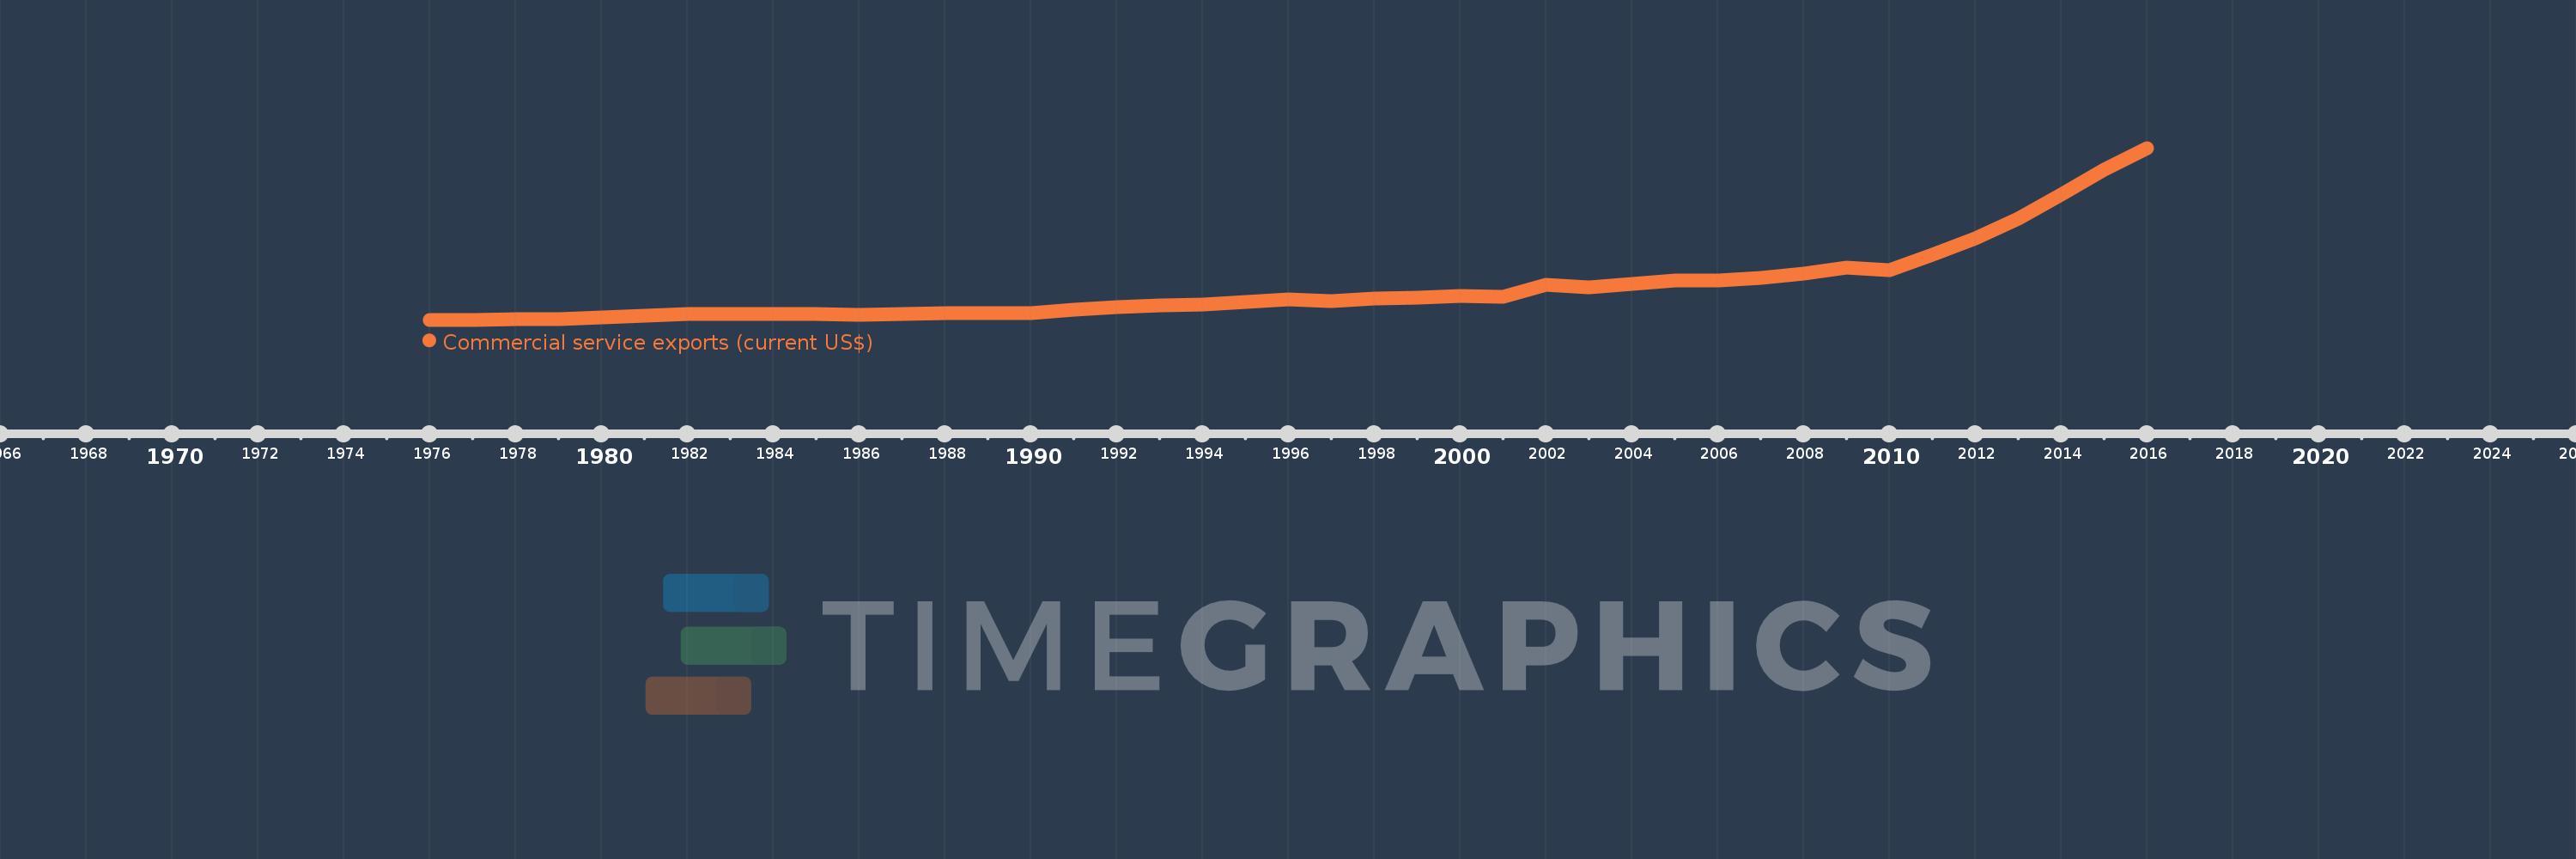
Commercial service exports (current US$)
2016,2015,2014,2013,2012,2011,2010,2009,2008,2007,2006,2005,2004,2003,2002,2001,2000,1999,1998,1997,1996,1995,1994,1993,1992,1991,1990,1989,1988,1987,1986,1985,1984,1983,1982,1981,1980,1979,1978,1977,1976
Cette statistique dans les autres pays:
AfghanistanAlbaniaAlgeriaAngolaAntigua and BarbudaArab WorldArgentinaArmeniaArubaAustraliaAustriaAzerbaijanBahamas, TheBahrainBangladeshBarbadosBelarusBelgiumBelizeBeninBermudaBhutanBoliviaBosnia and HerzegovinaBotswanaBrazilBrunei DarussalamBulgariaBurkina FasoBurundiCabo VerdeCambodiaCameroonCanadaCaribbean small statesCentral African RepublicCentral Europe and the BalticsChadChileChinaColombiaComorosCongo, Dem. Rep.Congo, Rep.Costa RicaCote d'IvoireCroatiaCuracaoCyprusCzech RepublicDenmarkDjiboutiDominicaDominican RepublicEarly-demographic dividendEast Asia & PacificEast Asia & Pacific (excluding high income)East Asia & Pacific (IDA & IBRD countries)EcuadorEgypt, Arab Rep.El SalvadorEquatorial GuineaEritreaEstoniaEthiopiaEuro areaEurope & Central AsiaEurope & Central Asia (excluding high income)Europe & Central Asia (IDA & IBRD countries)European UnionFaroe IslandsFijiFinlandFragile and conflict affected situationsFranceFrench PolynesiaGabonGambia, TheGeorgiaGermanyGhanaGreeceGrenadaGuatemalaGuineaGuinea-BissauGuyanaHaitiHeavily indebted poor countries (HIPC)High incomeHondurasHong Kong SAR, ChinaHungaryIBRD onlyIcelandIDA & IBRD totalIDA blendIDA onlyIDA totalIndiaIndonesiaIran, Islamic Rep.IraqIrelandIsraelItalyJamaicaJapanJordanKazakhstanKenyaKiribatiKorea, Rep.KosovoKuwaitKyrgyz RepublicLao PDRLate-demographic dividendLatin America & Caribbean Latin America & Caribbean (excluding high income)Latin America & the Caribbean (IDA & IBRD countries)LatviaLeast developed countries: UN classificationLebanonLesothoLiberiaLibyaLithuaniaLow & middle incomeLow incomeLower middle incomeLuxembourgMacao SAR, ChinaMacedonia, FYRMadagascarMalawiMalaysiaMaldivesMaliMaltaMarshall IslandsMauritaniaMauritiusMexicoMicronesia, Fed. Sts.Middle East & North Africa (excluding high income)Middle East & North Africa (IDA & IBRD countries)Middle incomeMoldovaMongoliaMontenegroMoroccoMozambiqueMyanmarNamibiaNepalNetherlandsNew CaledoniaNew ZealandNicaraguaNigerNigeriaNorth AmericaNorwayOECD membersOmanPacific island small statesPakistanPalauPanamaPapua New GuineaParaguayPeruPhilippinesPolandPortugalPost-demographic dividendPre-demographic dividendQatarRomaniaRussian FederationRwandaSamoaSao Tome and PrincipeSaudi ArabiaSenegalSerbiaSeychellesSierra LeoneSingaporeSint Maarten (Dutch part)Slovak RepublicSloveniaSolomon IslandsSouth AfricaSouth AsiaSouth Asia (IDA & IBRD)South SudanSpainSri LankaSt. Kitts and NevisSt. LuciaSt. Vincent and the GrenadinesSub-Saharan Africa Sub-Saharan Africa (excluding high income)Sub-Saharan Africa (IDA & IBRD countries)SudanSurinameSwazilandSwedenSwitzerlandSyrian Arab RepublicTajikistanTanzaniaThailandTimor-LesteTogoTongaTrinidad and TobagoTunisiaTurkeyTuvaluUgandaUkraineUnited KingdomUnited StatesUpper middle incomeUruguayVanuatuVenezuela, RBVietnamWest Bank and GazaWorldYemen, Rep.ZambiaZimbabwe La ligne de temps
Cette échelle de temps montre un graphique de 1976 année à 2016 année Sri Lanka. Les données jusqu'à 1975 année ne sont pas présentés. Quantité d'observations actuelles selon dates: 41.
Source (désignation):
Les indicateurs du développement mondiale
Source (organisation):
International Monetary Fund, Balance of Payments Statistics Yearbook and data files.
Catégories:
Private Sector, Trade
Dernière mise à jour
23 avr. 2017
Les indicateurs de changement de valeurs selon les années
Minimum:
66.572 mln.
1 janv. 1977
Maximum:
6.366 mds
1 janv. 2016
Pour la date d''observation
Valeur
Changement absolu
Le changement par rapport à la valeur précédente
1 janv. 1976
67.074 mln.
+67.074 mln.
0.0%
1 janv. 1977
66.572 mln.
-502.622 milles
-0.75%
1 janv. 1978
87.631 mln.
+21.06 mln.
31.63%
1 janv. 1979
97.472 mln.
+9.841 mln.
11.23%
1 janv. 1980
145.232 mln.
+47.76 mln.
49.0%
1 janv. 1981
223.307 mln.
+78.075 mln.
53.76%
1 janv. 1982
269.171 mln.
+45.864 mln.
20.54%
1 janv. 1983
277.435 mln.
+8.264 mln.
3.07%
1 janv. 1984
281.805 mln.
+4.37 mln.
1.58%
1 janv. 1985
264.218 mln.
-17.587 mln.
-6.24%
1 janv. 1986
233.936 mln.
-30.281 mln.
-11.46%
1 janv. 1987
291.427 mln.
+57.491 mln.
24.58%
1 janv. 1988
307.578 mln.
+16.151 mln.
5.54%
1 janv. 1989
315.96 mln.
+8.383 mln.
2.73%
1 janv. 1990
323.808 mln.
+7.848 mln.
2.48%
1 janv. 1991
425.006 mln.
+101.198 mln.
31.25%
1 janv. 1992
523.551 mln.
+98.545 mln.
23.19%
1 janv. 1993
602.432 mln.
+78.881 mln.
15.07%
1 janv. 1994
619.121 mln.
+16.689 mln.
2.77%
1 janv. 1995
729.06 mln.
+109.939 mln.
17.76%
1 janv. 1996
799.89 mln.
+70.83 mln.
9.72%
1 janv. 1997
741.22 mln.
-58.669 mln.
-7.33%
1 janv. 1998
850.307 mln.
+109.086 mln.
14.72%
1 janv. 1999
891.519 mln.
+41.213 mln.
4.85%
1 janv. 2000
939.542 mln.
+48.022 mln.
5.39%
1 janv. 2001
915.138 mln.
-24.403 mln.
-2.6%
1 janv. 2002
1.334 mds
+418.792 mln.
45.76%
1 janv. 2003
1.247 mds
-86.7 mln.
-6.5%
1 janv. 2004
1.389 mds
+141.97 mln.
11.38%
1 janv. 2005
1.506 mds
+117.08 mln.
8.43%
1 janv. 2006
1.519 mds
+12.461 mln.
0.83%
1 janv. 2007
1.604 mds
+84.959 mln.
5.59%
1 janv. 2008
1.755 mds
+151.0 mln.
9.42%
1 janv. 2009
1.981 mds
+226.7 mln.
12.92%
1 janv. 2010
1.873 mds
-107.9 mln.
-5.45%
1 janv. 2011
2.454 mds
+580.04 mln.
30.96%
1 janv. 2012
3.062 mds
+608.35 mln.
24.79%
1 janv. 2013
3.773 mds
+711.323 mln.
23.23%
1 janv. 2014
4.657 mds
+883.432 mln.
23.41%
1 janv. 2015
5.574 mds
+917.132 mln.
19.7%
1 janv. 2016
6.366 mds
+792.186 mln.
14.21%
Classement des pays selon les statistiques actuelles par années


Commentaires: