29
/fr/
fr
AIzaSyAYiBZKx7MnpbEhh9jyipgxe19OcubqV5w
April 1, 2024
197284
Moldova
MDA
true
2
1
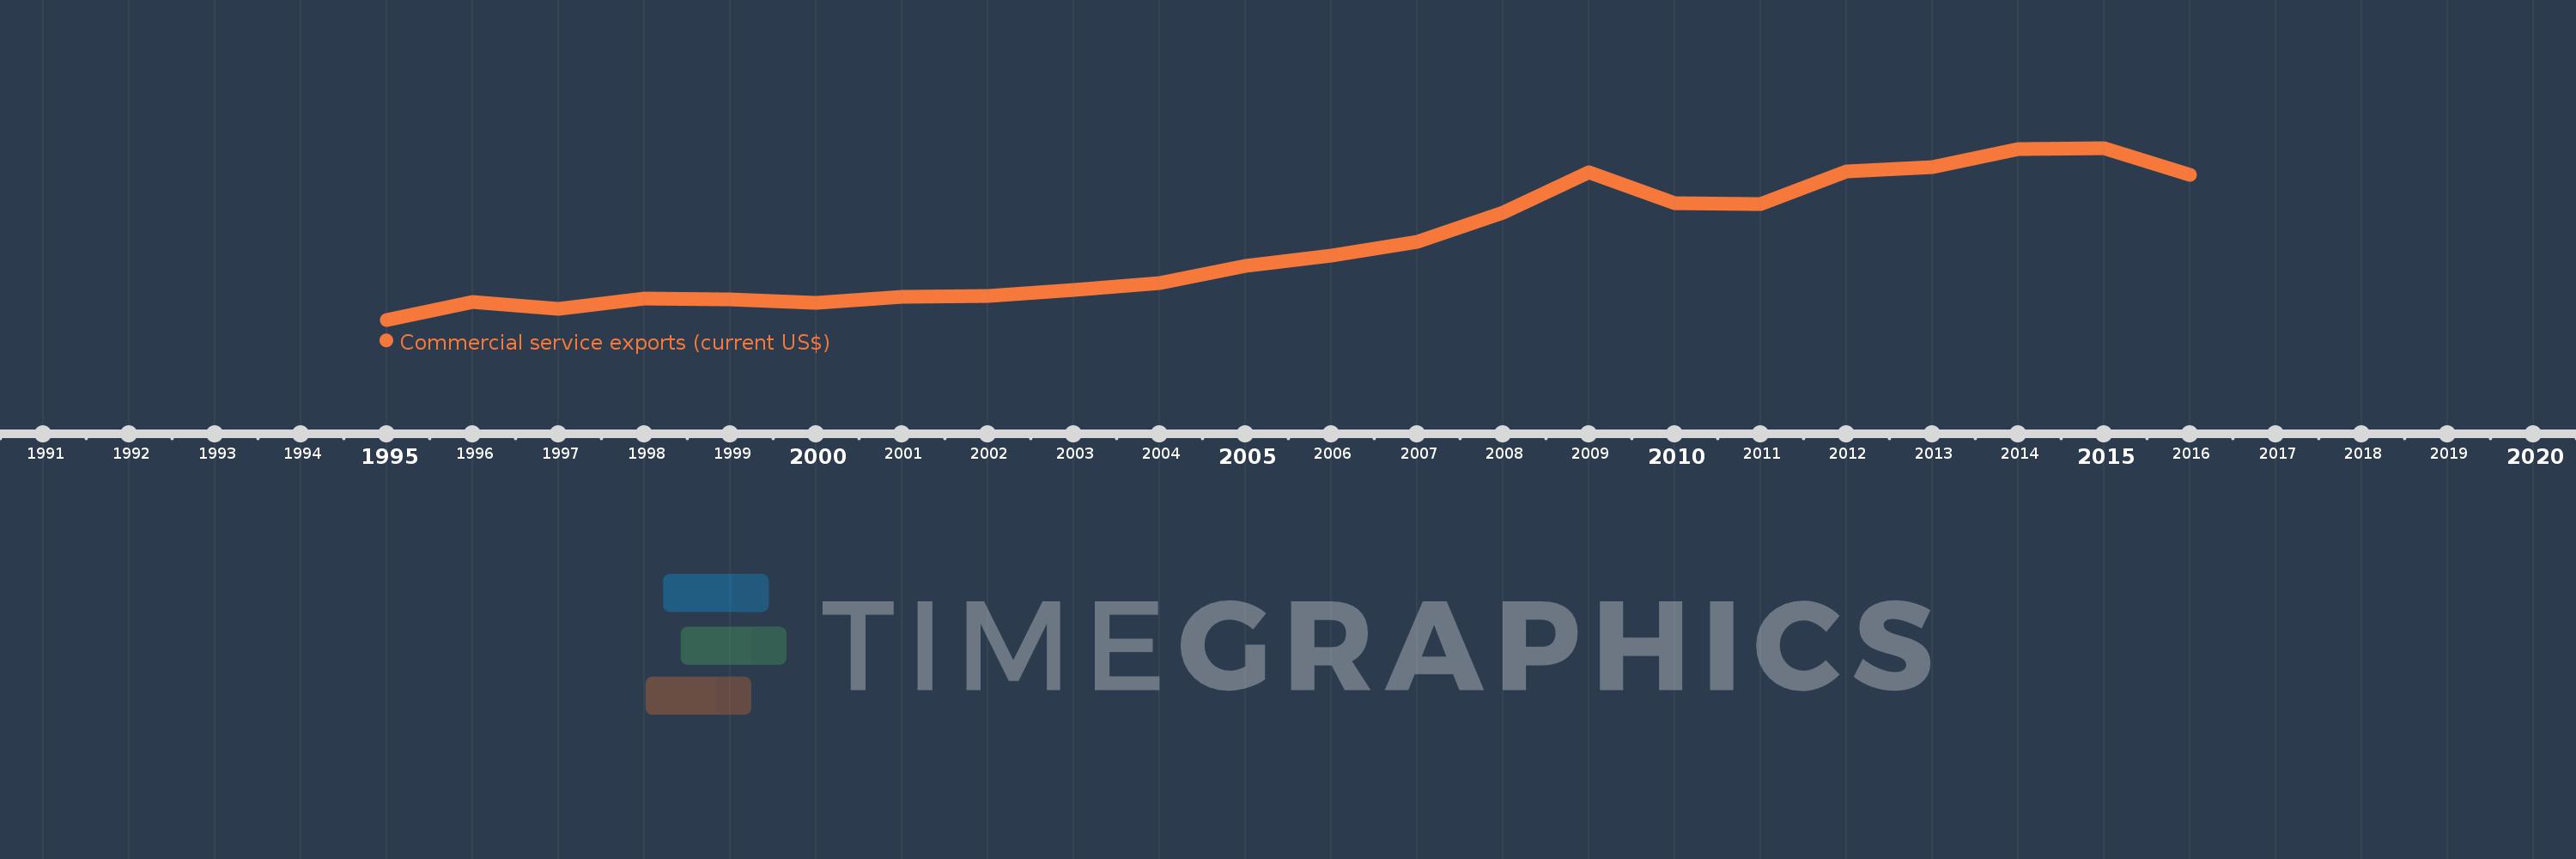
Commercial service exports (current US$)
2016,2015,2014,2013,2012,2011,2010,2009,2008,2007,2006,2005,2004,2003,2002,2001,2000,1999,1998,1997,1996,1995
Cette statistique dans les autres pays:
AfghanistanAlbaniaAlgeriaAngolaAntigua and BarbudaArab WorldArgentinaArmeniaArubaAustraliaAustriaAzerbaijanBahamas, TheBahrainBangladeshBarbadosBelarusBelgiumBelizeBeninBermudaBhutanBoliviaBosnia and HerzegovinaBotswanaBrazilBrunei DarussalamBulgariaBurkina FasoBurundiCabo VerdeCambodiaCameroonCanadaCaribbean small statesCentral African RepublicCentral Europe and the BalticsChadChileChinaColombiaComorosCongo, Dem. Rep.Congo, Rep.Costa RicaCote d'IvoireCroatiaCuracaoCyprusCzech RepublicDenmarkDjiboutiDominicaDominican RepublicEarly-demographic dividendEast Asia & PacificEast Asia & Pacific (excluding high income)East Asia & Pacific (IDA & IBRD countries)EcuadorEgypt, Arab Rep.El SalvadorEquatorial GuineaEritreaEstoniaEthiopiaEuro areaEurope & Central AsiaEurope & Central Asia (excluding high income)Europe & Central Asia (IDA & IBRD countries)European UnionFaroe IslandsFijiFinlandFragile and conflict affected situationsFranceFrench PolynesiaGabonGambia, TheGeorgiaGermanyGhanaGreeceGrenadaGuatemalaGuineaGuinea-BissauGuyanaHaitiHeavily indebted poor countries (HIPC)High incomeHondurasHong Kong SAR, ChinaHungaryIBRD onlyIcelandIDA & IBRD totalIDA blendIDA onlyIDA totalIndiaIndonesiaIran, Islamic Rep.IraqIrelandIsraelItalyJamaicaJapanJordanKazakhstanKenyaKiribatiKorea, Rep.KosovoKuwaitKyrgyz RepublicLao PDRLate-demographic dividendLatin America & Caribbean Latin America & Caribbean (excluding high income)Latin America & the Caribbean (IDA & IBRD countries)LatviaLeast developed countries: UN classificationLebanonLesothoLiberiaLibyaLithuaniaLow & middle incomeLow incomeLower middle incomeLuxembourgMacao SAR, ChinaMacedonia, FYRMadagascarMalawiMalaysiaMaldivesMaliMaltaMarshall IslandsMauritaniaMauritiusMexicoMicronesia, Fed. Sts.Middle East & North Africa (excluding high income)Middle East & North Africa (IDA & IBRD countries)Middle incomeMoldovaMongoliaMontenegroMoroccoMozambiqueMyanmarNamibiaNepalNetherlandsNew CaledoniaNew ZealandNicaraguaNigerNigeriaNorth AmericaNorwayOECD membersOmanPacific island small statesPakistanPalauPanamaPapua New GuineaParaguayPeruPhilippinesPolandPortugalPost-demographic dividendPre-demographic dividendQatarRomaniaRussian FederationRwandaSamoaSao Tome and PrincipeSaudi ArabiaSenegalSerbiaSeychellesSierra LeoneSingaporeSint Maarten (Dutch part)Slovak RepublicSloveniaSolomon IslandsSouth AfricaSouth AsiaSouth Asia (IDA & IBRD)South SudanSpainSri LankaSt. Kitts and NevisSt. LuciaSt. Vincent and the GrenadinesSub-Saharan Africa Sub-Saharan Africa (excluding high income)Sub-Saharan Africa (IDA & IBRD countries)SudanSurinameSwazilandSwedenSwitzerlandSyrian Arab RepublicTajikistanTanzaniaThailandTimor-LesteTogoTongaTrinidad and TobagoTunisiaTurkeyTuvaluUgandaUkraineUnited KingdomUnited StatesUpper middle incomeUruguayVanuatuVenezuela, RBVietnamWest Bank and GazaWorldYemen, Rep.ZambiaZimbabwe La ligne de temps
Cette échelle de temps montre un graphique de 1995 année à 2016 année Moldova. Les données jusqu'à 1994 année ne sont pas présentés. Quantité d'observations actuelles selon dates: 22.
Source (désignation):
Les indicateurs du développement mondiale
Source (organisation):
International Monetary Fund, Balance of Payments Statistics Yearbook and data files.
Catégories:
Private Sector, Trade
Dernière mise à jour
23 avr. 2017
Les indicateurs de changement de valeurs selon les années
Minimum:
32.808 mln.
1 janv. 1995
Maximum:
1.101 mds
1 janv. 2015
Pour la date d''observation
Valeur
Changement absolu
Le changement par rapport à la valeur précédente
1 janv. 1995
32.808 mln.
+32.808 mln.
0.0%
1 janv. 1996
143.19 mln.
+110.382 mln.
336.45%
1 janv. 1997
103.29 mln.
-39.9 mln.
-27.87%
1 janv. 1998
163.82 mln.
+60.53 mln.
58.6%
1 janv. 1999
160.1 mln.
-3.72 mln.
-2.27%
1 janv. 2000
140.5 mln.
-19.6 mln.
-12.24%
1 janv. 2001
174.75 mln.
+34.25 mln.
24.38%
1 janv. 2002
180.83 mln.
+6.08 mln.
3.48%
1 janv. 2003
220.19 mln.
+39.36 mln.
21.77%
1 janv. 2004
261.66 mln.
+41.47 mln.
18.83%
1 janv. 2005
367.73 mln.
+106.07 mln.
40.54%
1 janv. 2006
431.3 mln.
+63.57 mln.
17.29%
1 janv. 2007
516.84 mln.
+85.54 mln.
19.83%
1 janv. 2008
700.37 mln.
+183.53 mln.
35.51%
1 janv. 2009
950.06 mln.
+249.69 mln.
35.65%
1 janv. 2010
757.63 mln.
-192.43 mln.
-20.25%
1 janv. 2011
750.24 mln.
-7.39 mln.
-0.98%
1 janv. 2012
956.14 mln.
+205.9 mln.
27.44%
1 janv. 2013
981.99 mln.
+25.85 mln.
2.7%
1 janv. 2014
1.096 mds
+114.08 mln.
11.62%
1 janv. 2015
1.101 mds
+5.26 mln.
0.48%
1 janv. 2016
936.48 mln.
-164.85 mln.
-14.97%
Classement des pays selon les statistiques actuelles par années


Commentaires: