29
/fr/
fr
AIzaSyAYiBZKx7MnpbEhh9jyipgxe19OcubqV5w
April 1, 2024
53974
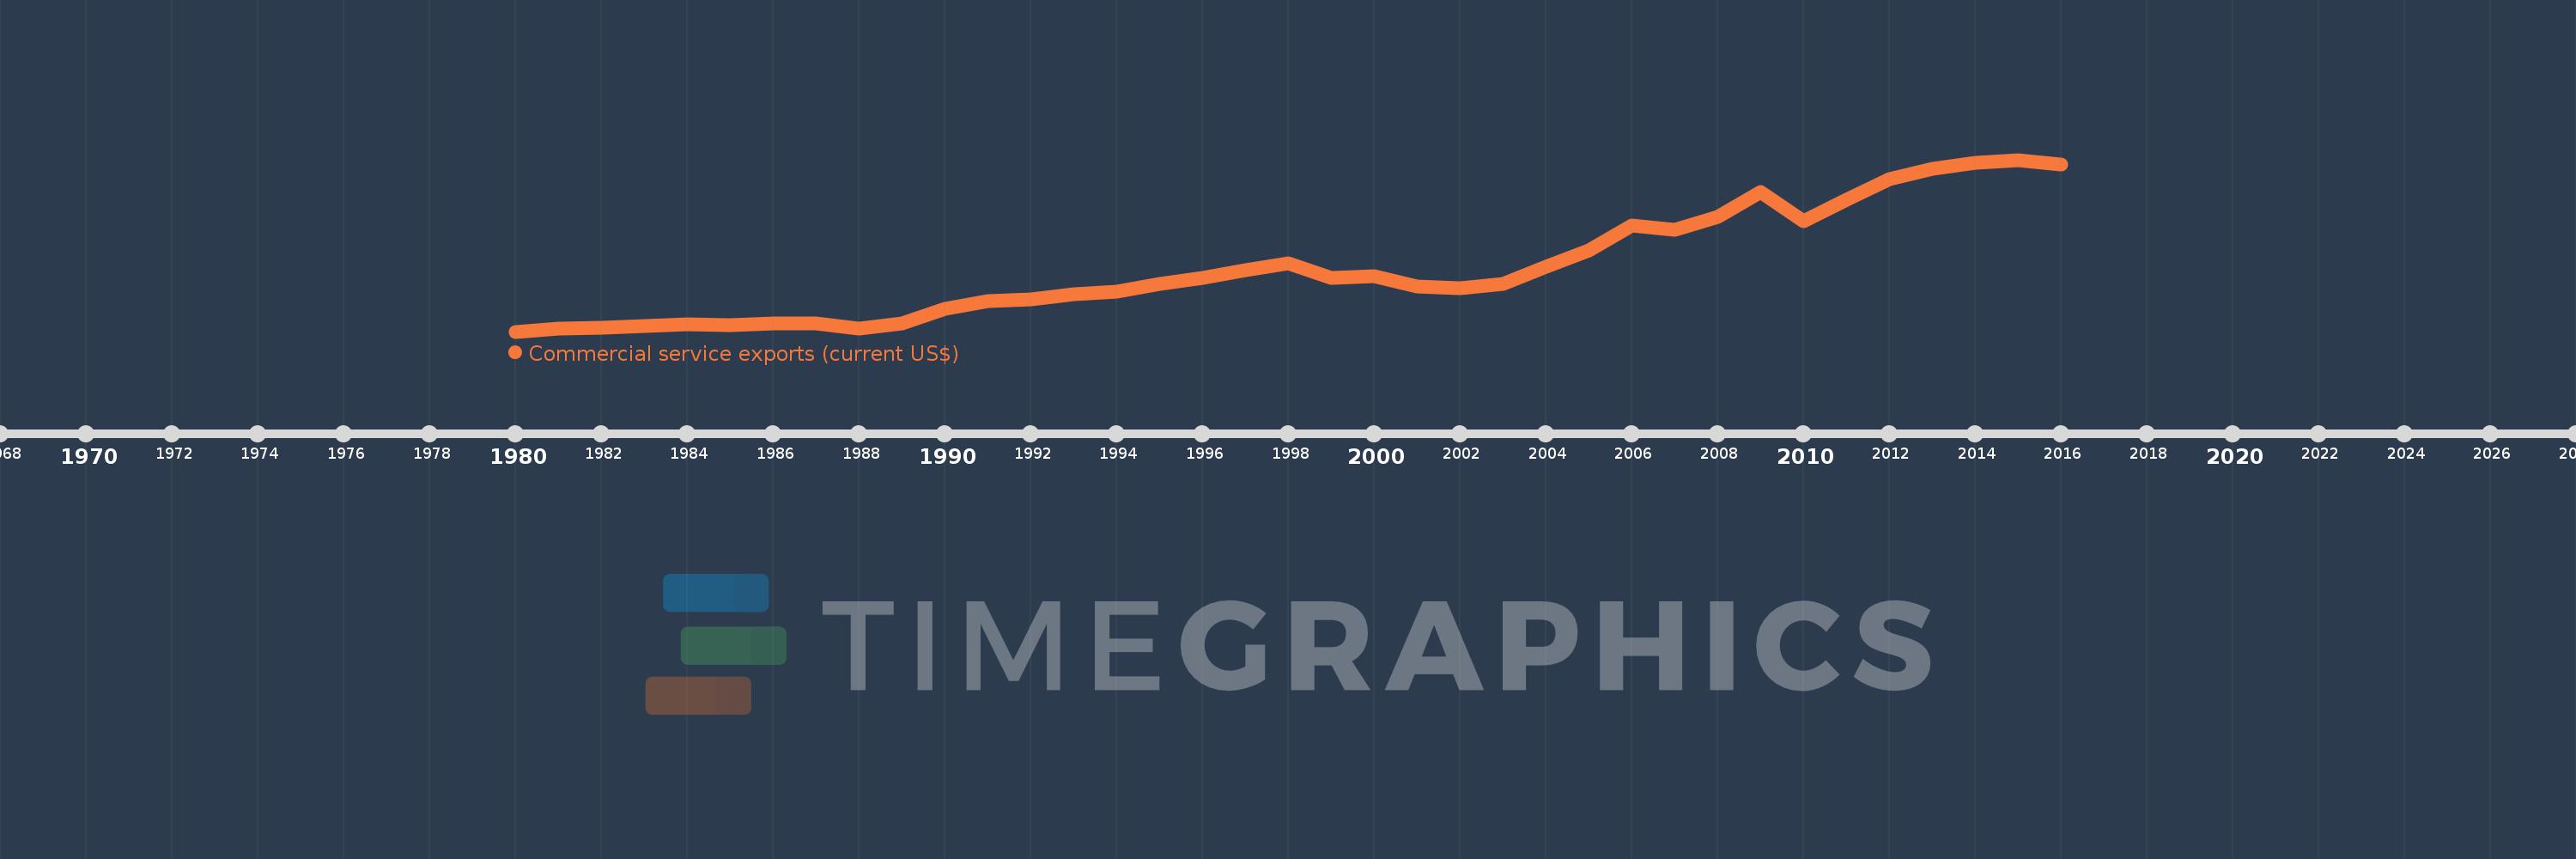
Pacific island small states
PSS
false
2
1
Commercial service exports (current US$)
2016,2015,2014,2013,2012,2011,2010,2009,2008,2007,2006,2005,2004,2003,2002,2001,2000,1999,1998,1997,1996,1995,1994,1993,1992,1991,1990,1989,1988,1987,1986,1985,1984,1983,1982,1981,1980
Cette statistique dans les autres pays:
AfghanistanAlbaniaAlgeriaAngolaAntigua and BarbudaArab WorldArgentinaArmeniaArubaAustraliaAustriaAzerbaijanBahamas, TheBahrainBangladeshBarbadosBelarusBelgiumBelizeBeninBermudaBhutanBoliviaBosnia and HerzegovinaBotswanaBrazilBrunei DarussalamBulgariaBurkina FasoBurundiCabo VerdeCambodiaCameroonCanadaCaribbean small statesCentral African RepublicCentral Europe and the BalticsChadChileChinaColombiaComorosCongo, Dem. Rep.Congo, Rep.Costa RicaCote d'IvoireCroatiaCuracaoCyprusCzech RepublicDenmarkDjiboutiDominicaDominican RepublicEarly-demographic dividendEast Asia & PacificEast Asia & Pacific (excluding high income)East Asia & Pacific (IDA & IBRD countries)EcuadorEgypt, Arab Rep.El SalvadorEquatorial GuineaEritreaEstoniaEthiopiaEuro areaEurope & Central AsiaEurope & Central Asia (excluding high income)Europe & Central Asia (IDA & IBRD countries)European UnionFaroe IslandsFijiFinlandFragile and conflict affected situationsFranceFrench PolynesiaGabonGambia, TheGeorgiaGermanyGhanaGreeceGrenadaGuatemalaGuineaGuinea-BissauGuyanaHaitiHeavily indebted poor countries (HIPC)High incomeHondurasHong Kong SAR, ChinaHungaryIBRD onlyIcelandIDA & IBRD totalIDA blendIDA onlyIDA totalIndiaIndonesiaIran, Islamic Rep.IraqIrelandIsraelItalyJamaicaJapanJordanKazakhstanKenyaKiribatiKorea, Rep.KosovoKuwaitKyrgyz RepublicLao PDRLate-demographic dividendLatin America & Caribbean Latin America & Caribbean (excluding high income)Latin America & the Caribbean (IDA & IBRD countries)LatviaLeast developed countries: UN classificationLebanonLesothoLiberiaLibyaLithuaniaLow & middle incomeLow incomeLower middle incomeLuxembourgMacao SAR, ChinaMacedonia, FYRMadagascarMalawiMalaysiaMaldivesMaliMaltaMarshall IslandsMauritaniaMauritiusMexicoMicronesia, Fed. Sts.Middle East & North Africa (excluding high income)Middle East & North Africa (IDA & IBRD countries)Middle incomeMoldovaMongoliaMontenegroMoroccoMozambiqueMyanmarNamibiaNepalNetherlandsNew CaledoniaNew ZealandNicaraguaNigerNigeriaNorth AmericaNorwayOECD membersOmanPacific island small statesPakistanPalauPanamaPapua New GuineaParaguayPeruPhilippinesPolandPortugalPost-demographic dividendPre-demographic dividendQatarRomaniaRussian FederationRwandaSamoaSao Tome and PrincipeSaudi ArabiaSenegalSerbiaSeychellesSierra LeoneSingaporeSint Maarten (Dutch part)Slovak RepublicSloveniaSolomon IslandsSouth AfricaSouth AsiaSouth Asia (IDA & IBRD)South SudanSpainSri LankaSt. Kitts and NevisSt. LuciaSt. Vincent and the GrenadinesSub-Saharan Africa Sub-Saharan Africa (excluding high income)Sub-Saharan Africa (IDA & IBRD countries)SudanSurinameSwazilandSwedenSwitzerlandSyrian Arab RepublicTajikistanTanzaniaThailandTimor-LesteTogoTongaTrinidad and TobagoTunisiaTurkeyTuvaluUgandaUkraineUnited KingdomUnited StatesUpper middle incomeUruguayVanuatuVenezuela, RBVietnamWest Bank and GazaWorldYemen, Rep.ZambiaZimbabwe La ligne de temps
Cette échelle de temps montre un graphique de 1980 année à 2016 année Pacific island small states. Les données jusqu'à 1979 année ne sont pas présentés. Quantité d'observations actuelles selon dates: 37.
Source (désignation):
Les indicateurs du développement mondiale
Source (organisation):
International Monetary Fund, Balance of Payments Statistics Yearbook and data files.
Catégories:
Private Sector, Trade
Dernière mise à jour
23 avr. 2017
Les indicateurs de changement de valeurs selon les années
Minimum:
244.108 mln.
1 janv. 1980
Maximum:
2.067 mds
1 janv. 2015
Pour la date d''observation
Valeur
Changement absolu
Le changement par rapport à la valeur précédente
1 janv. 1980
244.108 mln.
+244.108 mln.
0.0%
1 janv. 1981
272.668 mln.
+28.561 mln.
11.7%
1 janv. 1982
288.879 mln.
+16.211 mln.
5.95%
1 janv. 1983
302.895 mln.
+14.015 mln.
4.85%
1 janv. 1984
321.749 mln.
+18.855 mln.
6.22%
1 janv. 1985
312.299 mln.
-9.45 mln.
-2.94%
1 janv. 1986
335.223 mln.
+22.923 mln.
7.34%
1 janv. 1987
328.199 mln.
-7.023 mln.
-2.1%
1 janv. 1988
275.622 mln.
-52.578 mln.
-16.02%
1 janv. 1989
331.599 mln.
+55.977 mln.
20.31%
1 janv. 1990
483.288 mln.
+151.689 mln.
45.74%
1 janv. 1991
566.112 mln.
+82.824 mln.
17.14%
1 janv. 1992
581.546 mln.
+15.434 mln.
2.73%
1 janv. 1993
638.005 mln.
+56.459 mln.
9.71%
1 janv. 1994
671.604 mln.
+33.599 mln.
5.27%
1 janv. 1995
753.783 mln.
+82.179 mln.
12.24%
1 janv. 1996
809.962 mln.
+56.179 mln.
7.45%
1 janv. 1997
894.569 mln.
+84.607 mln.
10.45%
1 janv. 1998
965.004 mln.
+70.435 mln.
7.87%
1 janv. 1999
812.126 mln.
-152.878 mln.
-15.84%
1 janv. 2000
828.761 mln.
+16.636 mln.
2.05%
1 janv. 2001
720.998 mln.
-107.763 mln.
-13.0%
1 janv. 2002
702.021 mln.
-18.978 mln.
-2.63%
1 janv. 2003
750.06 mln.
+48.04 mln.
6.84%
1 janv. 2004
929.193 mln.
+179.132 mln.
23.88%
1 janv. 2005
1.109 mds
+179.797 mln.
19.35%
1 janv. 2006
1.365 mds
+256.454 mln.
23.13%
1 janv. 2007
1.32 mds
-45.63 mln.
-3.34%
1 janv. 2008
1.459 mds
+138.89 mln.
10.52%
1 janv. 2009
1.721 mds
+262.477 mln.
17.99%
1 janv. 2010
1.415 mds
-305.894 mln.
-17.77%
1 janv. 2011
1.643 mds
+227.877 mln.
16.1%
1 janv. 2012
1.864 mds
+221.044 mln.
13.45%
1 janv. 2013
1.971 mds
+106.44 mln.
5.71%
1 janv. 2014
2.032 mds
+61.59 mln.
3.13%
1 janv. 2015
2.067 mds
+34.311 mln.
1.69%
1 janv. 2016
2.016 mds
-50.998 mln.
-2.47%
Classement des pays selon les statistiques actuelles par années


Commentaires: