29
/fr/
fr
AIzaSyAYiBZKx7MnpbEhh9jyipgxe19OcubqV5w
April 1, 2024
266657
Trinidad and Tobago
TTO
true
2
1
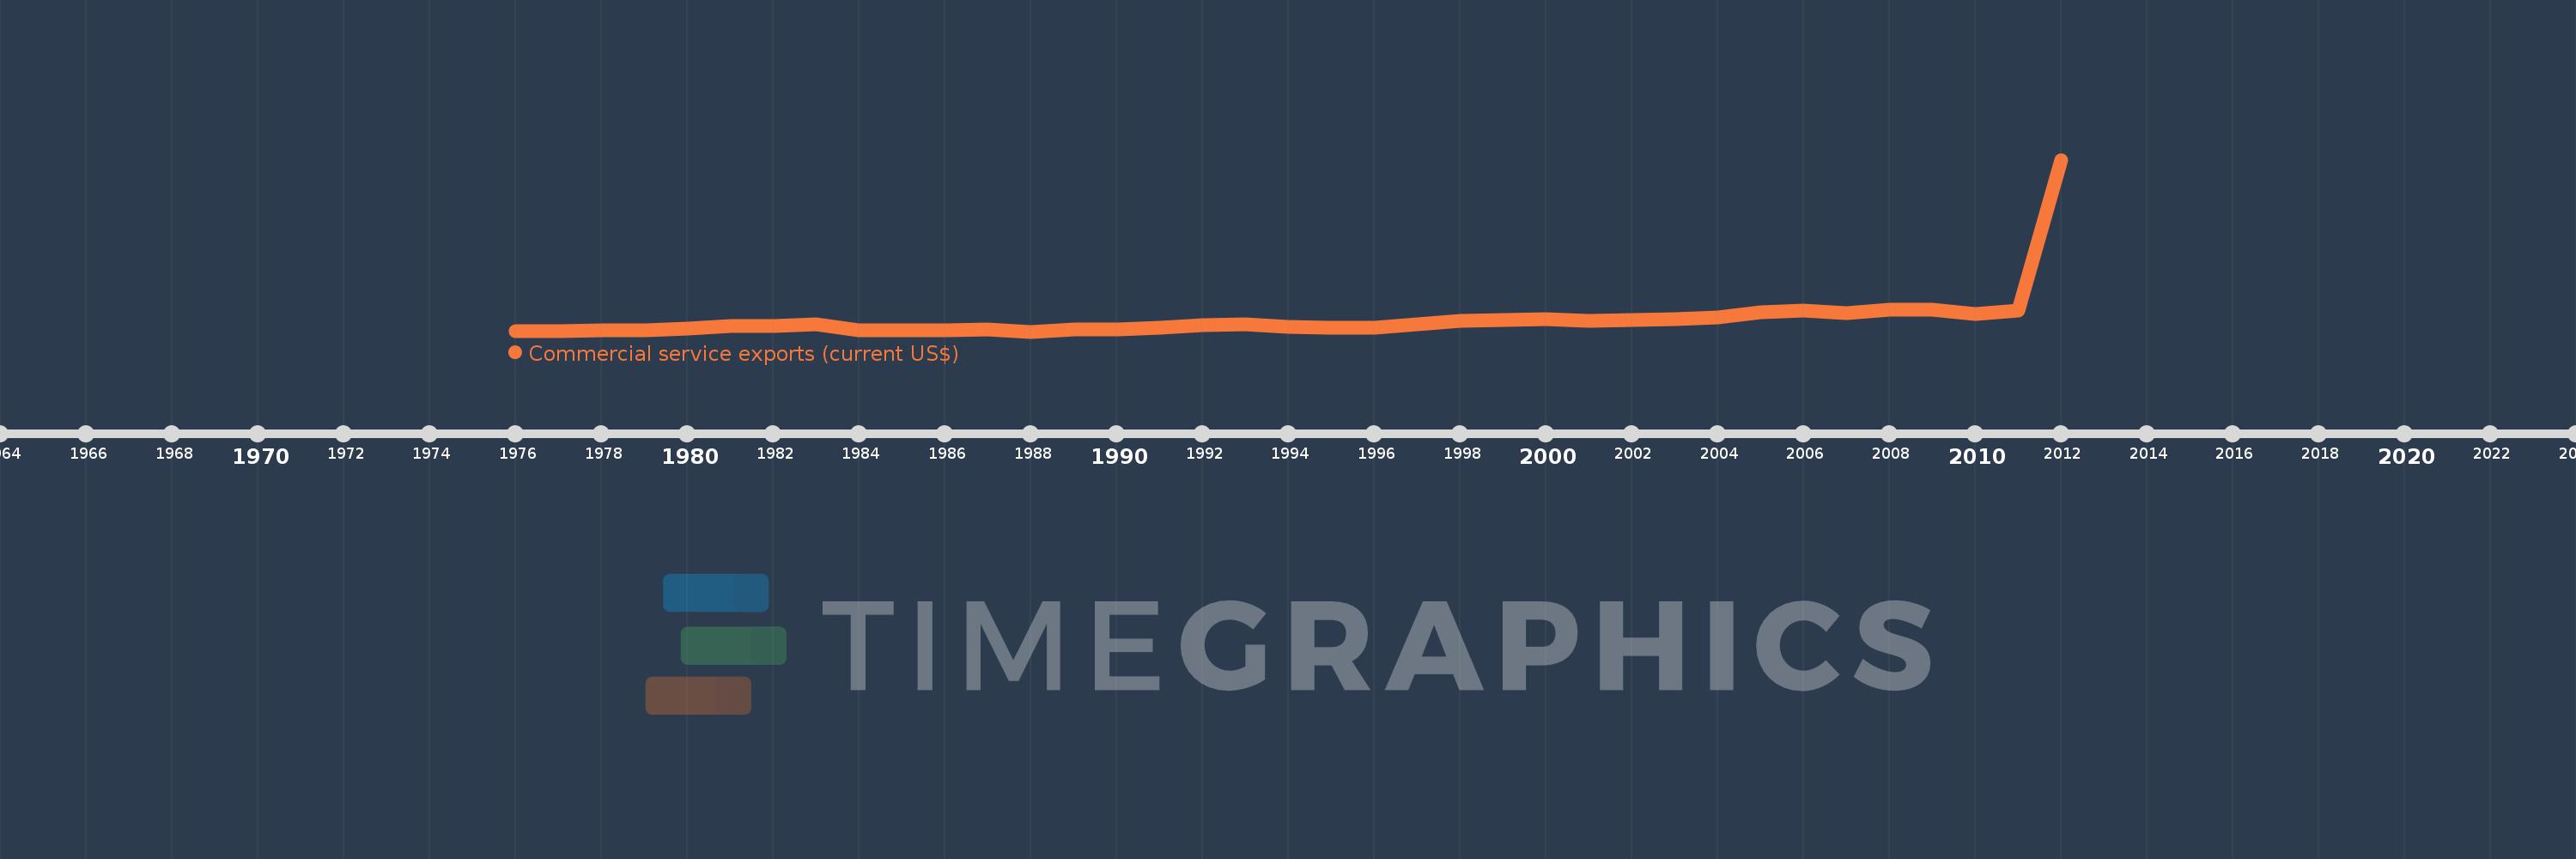
Commercial service exports (current US$)
2012,2011,2010,2009,2008,2007,2006,2005,2004,2003,2002,2001,2000,1999,1998,1997,1996,1995,1994,1993,1992,1991,1990,1989,1988,1987,1986,1985,1984,1983,1982,1981,1980,1979,1978,1977,1976
Cette statistique dans les autres pays:
AfghanistanAlbaniaAlgeriaAngolaAntigua and BarbudaArab WorldArgentinaArmeniaArubaAustraliaAustriaAzerbaijanBahamas, TheBahrainBangladeshBarbadosBelarusBelgiumBelizeBeninBermudaBhutanBoliviaBosnia and HerzegovinaBotswanaBrazilBrunei DarussalamBulgariaBurkina FasoBurundiCabo VerdeCambodiaCameroonCanadaCaribbean small statesCentral African RepublicCentral Europe and the BalticsChadChileChinaColombiaComorosCongo, Dem. Rep.Congo, Rep.Costa RicaCote d'IvoireCroatiaCuracaoCyprusCzech RepublicDenmarkDjiboutiDominicaDominican RepublicEarly-demographic dividendEast Asia & PacificEast Asia & Pacific (excluding high income)East Asia & Pacific (IDA & IBRD countries)EcuadorEgypt, Arab Rep.El SalvadorEquatorial GuineaEritreaEstoniaEthiopiaEuro areaEurope & Central AsiaEurope & Central Asia (excluding high income)Europe & Central Asia (IDA & IBRD countries)European UnionFaroe IslandsFijiFinlandFragile and conflict affected situationsFranceFrench PolynesiaGabonGambia, TheGeorgiaGermanyGhanaGreeceGrenadaGuatemalaGuineaGuinea-BissauGuyanaHaitiHeavily indebted poor countries (HIPC)High incomeHondurasHong Kong SAR, ChinaHungaryIBRD onlyIcelandIDA & IBRD totalIDA blendIDA onlyIDA totalIndiaIndonesiaIran, Islamic Rep.IraqIrelandIsraelItalyJamaicaJapanJordanKazakhstanKenyaKiribatiKorea, Rep.KosovoKuwaitKyrgyz RepublicLao PDRLate-demographic dividendLatin America & Caribbean Latin America & Caribbean (excluding high income)Latin America & the Caribbean (IDA & IBRD countries)LatviaLeast developed countries: UN classificationLebanonLesothoLiberiaLibyaLithuaniaLow & middle incomeLow incomeLower middle incomeLuxembourgMacao SAR, ChinaMacedonia, FYRMadagascarMalawiMalaysiaMaldivesMaliMaltaMarshall IslandsMauritaniaMauritiusMexicoMicronesia, Fed. Sts.Middle East & North Africa (excluding high income)Middle East & North Africa (IDA & IBRD countries)Middle incomeMoldovaMongoliaMontenegroMoroccoMozambiqueMyanmarNamibiaNepalNetherlandsNew CaledoniaNew ZealandNicaraguaNigerNigeriaNorth AmericaNorwayOECD membersOmanPacific island small statesPakistanPalauPanamaPapua New GuineaParaguayPeruPhilippinesPolandPortugalPost-demographic dividendPre-demographic dividendQatarRomaniaRussian FederationRwandaSamoaSao Tome and PrincipeSaudi ArabiaSenegalSerbiaSeychellesSierra LeoneSingaporeSint Maarten (Dutch part)Slovak RepublicSloveniaSolomon IslandsSouth AfricaSouth AsiaSouth Asia (IDA & IBRD)South SudanSpainSri LankaSt. Kitts and NevisSt. LuciaSt. Vincent and the GrenadinesSub-Saharan Africa Sub-Saharan Africa (excluding high income)Sub-Saharan Africa (IDA & IBRD countries)SudanSurinameSwazilandSwedenSwitzerlandSyrian Arab RepublicTajikistanTanzaniaThailandTimor-LesteTogoTongaTrinidad and TobagoTunisiaTurkeyTuvaluUgandaUkraineUnited KingdomUnited StatesUpper middle incomeUruguayVanuatuVenezuela, RBVietnamWest Bank and GazaWorldYemen, Rep.ZambiaZimbabwe La ligne de temps
Cette échelle de temps montre un graphique de 1976 année à 2012 année Trinidad and Tobago. Les données jusqu'à 1975 année ne sont pas présentés. Quantité d'observations actuelles selon dates: 37.
Source (désignation):
Les indicateurs du développement mondiale
Source (organisation):
International Monetary Fund, Balance of Payments Statistics Yearbook and data files.
Catégories:
Private Sector, Trade
Dernière mise à jour
23 avr. 2017
Les indicateurs de changement de valeurs selon les années
Minimum:
195.944 mln.
1 janv. 1988
Maximum:
5.798 mds
1 janv. 2012
Pour la date d''observation
Valeur
Changement absolu
Le changement par rapport à la valeur précédente
1 janv. 1976
204.581 mln.
+204.581 mln.
0.0%
1 janv. 1977
221.571 mln.
+16.99 mln.
8.3%
1 janv. 1978
245.458 mln.
+23.887 mln.
10.78%
1 janv. 1979
243.875 mln.
-1.583 mln.
-0.65%
1 janv. 1980
284.0 mln.
+40.125 mln.
16.45%
1 janv. 1981
383.417 mln.
+99.417 mln.
35.01%
1 janv. 1982
386.958 mln.
+3.542 mln.
0.92%
1 janv. 1983
434.75 mln.
+47.792 mln.
12.35%
1 janv. 1984
230.25 mln.
-204.5 mln.
-47.04%
1 janv. 1985
248.5 mln.
+18.25 mln.
7.93%
1 janv. 1986
245.592 mln.
-2.908 mln.
-1.17%
1 janv. 1987
258.056 mln.
+12.464 mln.
5.07%
1 janv. 1988
195.944 mln.
-62.111 mln.
-24.07%
1 janv. 1989
259.902 mln.
+63.958 mln.
32.64%
1 janv. 1990
267.506 mln.
+7.603 mln.
2.93%
1 janv. 1991
321.859 mln.
+54.353 mln.
20.32%
1 janv. 1992
397.082 mln.
+75.224 mln.
23.37%
1 janv. 1993
444.235 mln.
+47.153 mln.
11.87%
1 janv. 1994
343.163 mln.
-101.072 mln.
-22.75%
1 janv. 1995
317.303 mln.
-25.86 mln.
-7.54%
1 janv. 1996
330.728 mln.
+13.424 mln.
4.23%
1 janv. 1997
447.272 mln.
+116.545 mln.
35.24%
1 janv. 1998
535.36 mln.
+88.088 mln.
19.69%
1 janv. 1999
573.916 mln.
+38.556 mln.
7.2%
1 janv. 2000
605.2 mln.
+31.284 mln.
5.45%
1 janv. 2001
543.2 mln.
-62.0 mln.
-10.24%
1 janv. 2002
566.7 mln.
+23.5 mln.
4.33%
1 janv. 2003
598.8 mln.
+32.1 mln.
5.66%
1 janv. 2004
671.9 mln.
+73.1 mln.
12.21%
1 janv. 2005
837.6 mln.
+165.7 mln.
24.66%
1 janv. 2006
882.9 mln.
+45.3 mln.
5.41%
1 janv. 2007
801.5 mln.
-81.4 mln.
-9.22%
1 janv. 2008
909.9 mln.
+108.4 mln.
13.52%
1 janv. 2009
918.3 mln.
+8.4 mln.
0.92%
1 janv. 2010
758.4 mln.
-159.9 mln.
-17.41%
1 janv. 2011
868.8 mln.
+110.4 mln.
14.56%
1 janv. 2012
5.798 mds
+4.93 mds
567.4%
Classement des pays selon les statistiques actuelles par années


Commentaires: