29
/fr/
fr
AIzaSyAYiBZKx7MnpbEhh9jyipgxe19OcubqV5w
April 1, 2024
264357
Togo
TGO
true
2
1
Commercial service exports (current US$)
2015,2014,2013,2012,2011,2010,2009,2008,2007,2006,2005,2004,2003,2002,2001,2000,1999,1998,1997,1996,1995,1994,1993,1992,1991,1990,1989,1988,1987,1986,1985,1984,1983,1982,1981,1980,1979,1978,1977,1976,1975
Cette statistique dans les autres pays:
AfghanistanAlbaniaAlgeriaAngolaAntigua and BarbudaArab WorldArgentinaArmeniaArubaAustraliaAustriaAzerbaijanBahamas, TheBahrainBangladeshBarbadosBelarusBelgiumBelizeBeninBermudaBhutanBoliviaBosnia and HerzegovinaBotswanaBrazilBrunei DarussalamBulgariaBurkina FasoBurundiCabo VerdeCambodiaCameroonCanadaCaribbean small statesCentral African RepublicCentral Europe and the BalticsChadChileChinaColombiaComorosCongo, Dem. Rep.Congo, Rep.Costa RicaCote d'IvoireCroatiaCuracaoCyprusCzech RepublicDenmarkDjiboutiDominicaDominican RepublicEarly-demographic dividendEast Asia & PacificEast Asia & Pacific (excluding high income)East Asia & Pacific (IDA & IBRD countries)EcuadorEgypt, Arab Rep.El SalvadorEquatorial GuineaEritreaEstoniaEthiopiaEuro areaEurope & Central AsiaEurope & Central Asia (excluding high income)Europe & Central Asia (IDA & IBRD countries)European UnionFaroe IslandsFijiFinlandFragile and conflict affected situationsFranceFrench PolynesiaGabonGambia, TheGeorgiaGermanyGhanaGreeceGrenadaGuatemalaGuineaGuinea-BissauGuyanaHaitiHeavily indebted poor countries (HIPC)High incomeHondurasHong Kong SAR, ChinaHungaryIBRD onlyIcelandIDA & IBRD totalIDA blendIDA onlyIDA totalIndiaIndonesiaIran, Islamic Rep.IraqIrelandIsraelItalyJamaicaJapanJordanKazakhstanKenyaKiribatiKorea, Rep.KosovoKuwaitKyrgyz RepublicLao PDRLate-demographic dividendLatin America & Caribbean Latin America & Caribbean (excluding high income)Latin America & the Caribbean (IDA & IBRD countries)LatviaLeast developed countries: UN classificationLebanonLesothoLiberiaLibyaLithuaniaLow & middle incomeLow incomeLower middle incomeLuxembourgMacao SAR, ChinaMacedonia, FYRMadagascarMalawiMalaysiaMaldivesMaliMaltaMarshall IslandsMauritaniaMauritiusMexicoMicronesia, Fed. Sts.Middle East & North Africa (excluding high income)Middle East & North Africa (IDA & IBRD countries)Middle incomeMoldovaMongoliaMontenegroMoroccoMozambiqueMyanmarNamibiaNepalNetherlandsNew CaledoniaNew ZealandNicaraguaNigerNigeriaNorth AmericaNorwayOECD membersOmanPacific island small statesPakistanPalauPanamaPapua New GuineaParaguayPeruPhilippinesPolandPortugalPost-demographic dividendPre-demographic dividendQatarRomaniaRussian FederationRwandaSamoaSao Tome and PrincipeSaudi ArabiaSenegalSerbiaSeychellesSierra LeoneSingaporeSint Maarten (Dutch part)Slovak RepublicSloveniaSolomon IslandsSouth AfricaSouth AsiaSouth Asia (IDA & IBRD)South SudanSpainSri LankaSt. Kitts and NevisSt. LuciaSt. Vincent and the GrenadinesSub-Saharan Africa Sub-Saharan Africa (excluding high income)Sub-Saharan Africa (IDA & IBRD countries)SudanSurinameSwazilandSwedenSwitzerlandSyrian Arab RepublicTajikistanTanzaniaThailandTimor-LesteTogoTongaTrinidad and TobagoTunisiaTurkeyTuvaluUgandaUkraineUnited KingdomUnited StatesUpper middle incomeUruguayVanuatuVenezuela, RBVietnamWest Bank and GazaWorldYemen, Rep.ZambiaZimbabwe La ligne de temps
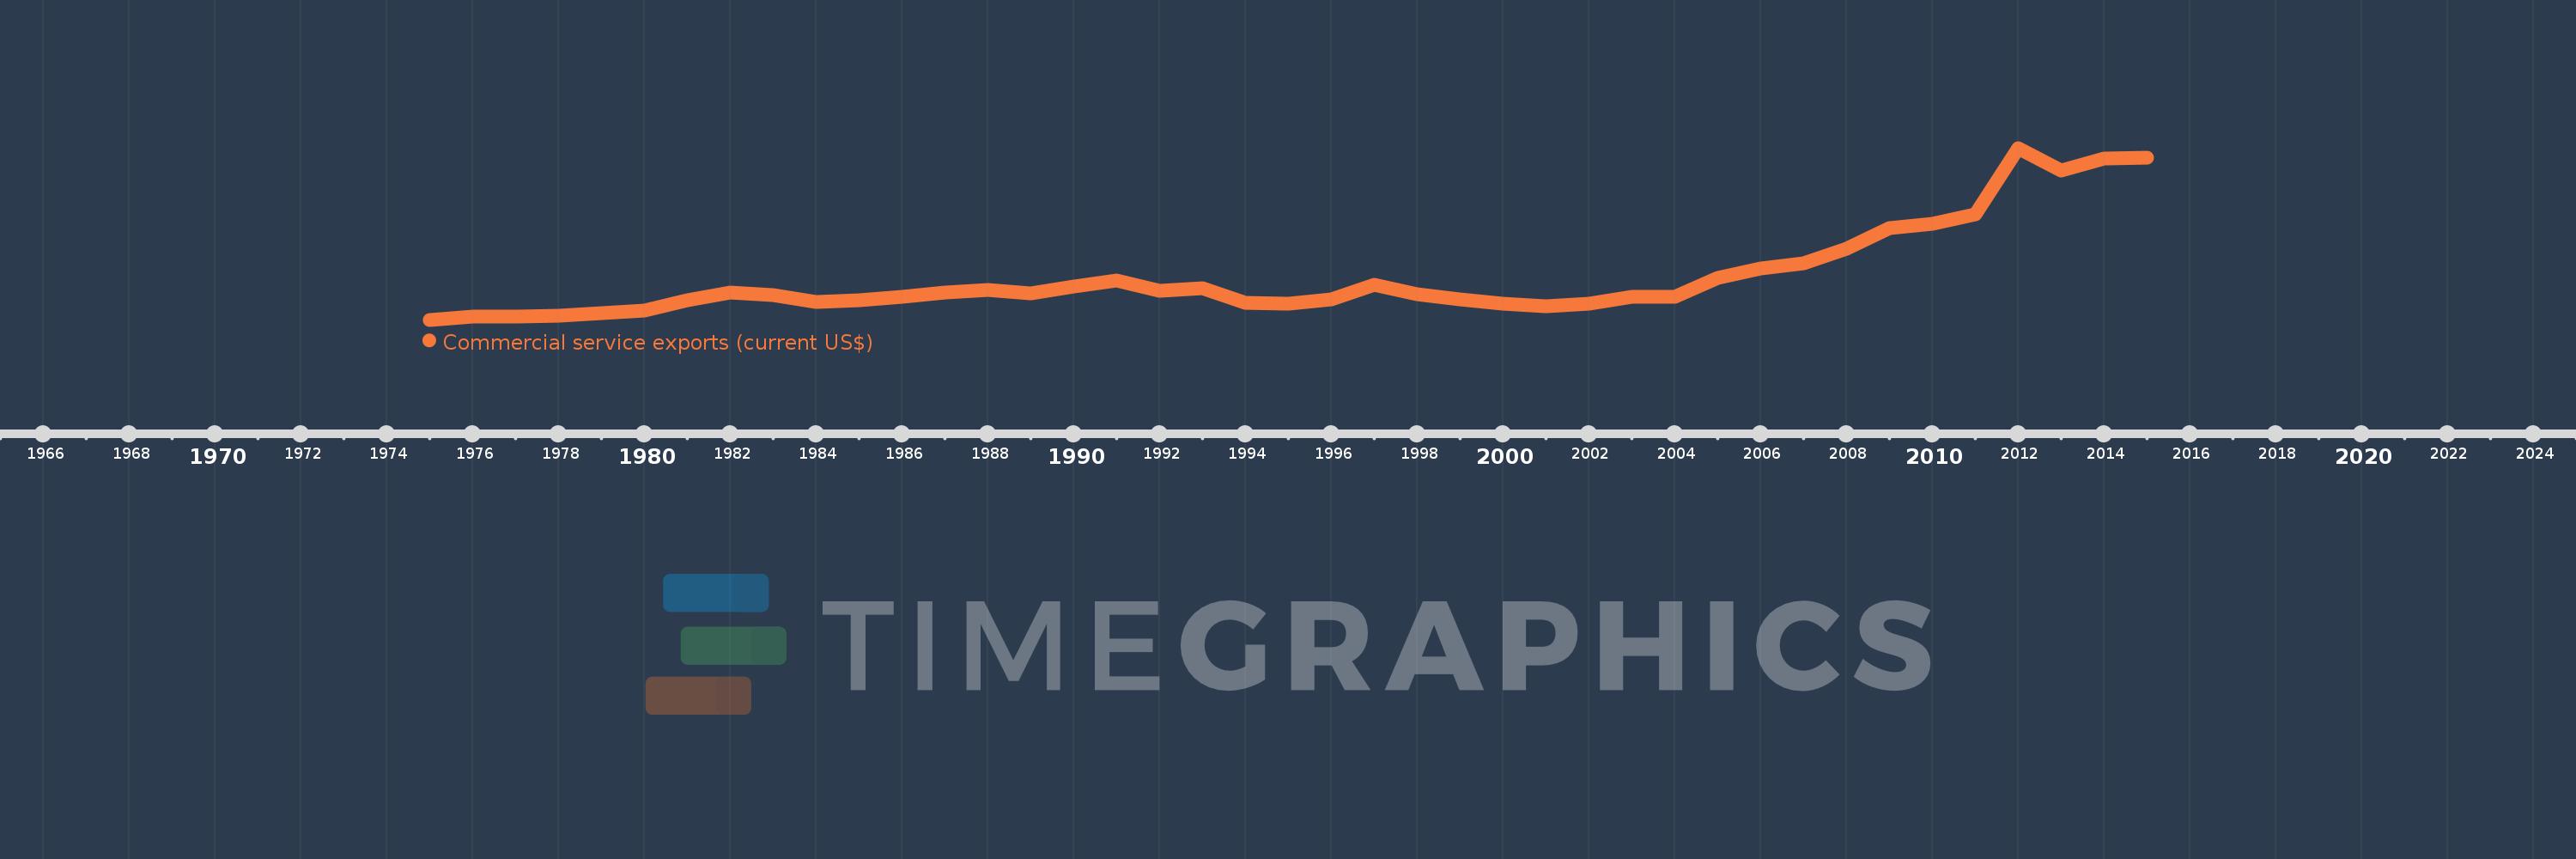
Cette échelle de temps montre un graphique de 1975 année à 2015 année Togo. Les données jusqu'à 1974 année ne sont pas présentés. Quantité d'observations actuelles selon dates: 41.
Source (désignation):
Les indicateurs du développement mondiale
Source (organisation):
International Monetary Fund, Balance of Payments Statistics Yearbook and data files.
Catégories:
Private Sector, Trade
Dernière mise à jour
23 avr. 2017
Les indicateurs de changement de valeurs selon les années
Minimum:
10.262 mln.
1 janv. 1975
Maximum:
464.184 mln.
1 janv. 2012
Pour la date d''observation
Valeur
Changement absolu
Le changement par rapport à la valeur précédente
1 janv. 1975
10.262 mln.
+10.262 mln.
0.0%
1 janv. 1976
18.641 mln.
+8.379 mln.
81.66%
1 janv. 1977
18.355 mln.
-285.702 milles
-1.53%
1 janv. 1978
21.801 mln.
+3.445 mln.
18.77%
1 janv. 1979
28.854 mln.
+7.053 mln.
32.35%
1 janv. 1980
34.444 mln.
+5.59 mln.
19.38%
1 janv. 1981
61.293 mln.
+26.849 mln.
77.95%
1 janv. 1982
81.978 mln.
+20.685 mln.
33.75%
1 janv. 1983
74.974 mln.
-7.004 mln.
-8.54%
1 janv. 1984
57.665 mln.
-17.31 mln.
-23.09%
1 janv. 1985
62.805 mln.
+5.14 mln.
8.91%
1 janv. 1986
70.76 mln.
+7.955 mln.
12.67%
1 janv. 1987
81.538 mln.
+10.777 mln.
15.23%
1 janv. 1988
88.139 mln.
+6.601 mln.
8.1%
1 janv. 1989
79.013 mln.
-9.126 mln.
-10.35%
1 janv. 1990
98.396 mln.
+19.382 mln.
24.53%
1 janv. 1991
114.128 mln.
+15.732 mln.
15.99%
1 janv. 1992
87.371 mln.
-26.757 mln.
-23.44%
1 janv. 1993
93.316 mln.
+5.945 mln.
6.8%
1 janv. 1994
54.538 mln.
-38.779 mln.
-41.56%
1 janv. 1995
51.651 mln.
-2.886 mln.
-5.29%
1 janv. 1996
63.648 mln.
+11.997 mln.
23.23%
1 janv. 1997
101.696 mln.
+38.048 mln.
59.78%
1 janv. 1998
77.681 mln.
-24.015 mln.
-23.61%
1 janv. 1999
64.971 mln.
-12.71 mln.
-16.36%
1 janv. 2000
53.825 mln.
-11.146 mln.
-17.16%
1 janv. 2001
45.652 mln.
-8.173 mln.
-15.18%
1 janv. 2002
53.195 mln.
+7.543 mln.
16.52%
1 janv. 2003
71.988 mln.
+18.793 mln.
35.33%
1 janv. 2004
71.915 mln.
-73.341 milles
-0.1%
1 janv. 2005
121.819 mln.
+49.904 mln.
69.39%
1 janv. 2006
145.309 mln.
+23.491 mln.
19.28%
1 janv. 2007
159.267 mln.
+13.957 mln.
9.61%
1 janv. 2008
197.454 mln.
+38.187 mln.
23.98%
1 janv. 2009
253.219 mln.
+55.766 mln.
28.24%
1 janv. 2010
264.844 mln.
+11.625 mln.
4.59%
1 janv. 2011
289.123 mln.
+24.279 mln.
9.17%
1 janv. 2012
464.184 mln.
+175.061 mln.
60.55%
1 janv. 2013
405.382 mln.
-58.802 mln.
-12.67%
1 janv. 2014
437.001 mln.
+31.619 mln.
7.8%
1 janv. 2015
439.652 mln.
+2.65 mln.
0.61%
Classement des pays selon les statistiques actuelles par années


Commentaires: