29
/fr/
fr
AIzaSyAYiBZKx7MnpbEhh9jyipgxe19OcubqV5w
April 1, 2024
160303
Israel
ISR
true
2
1
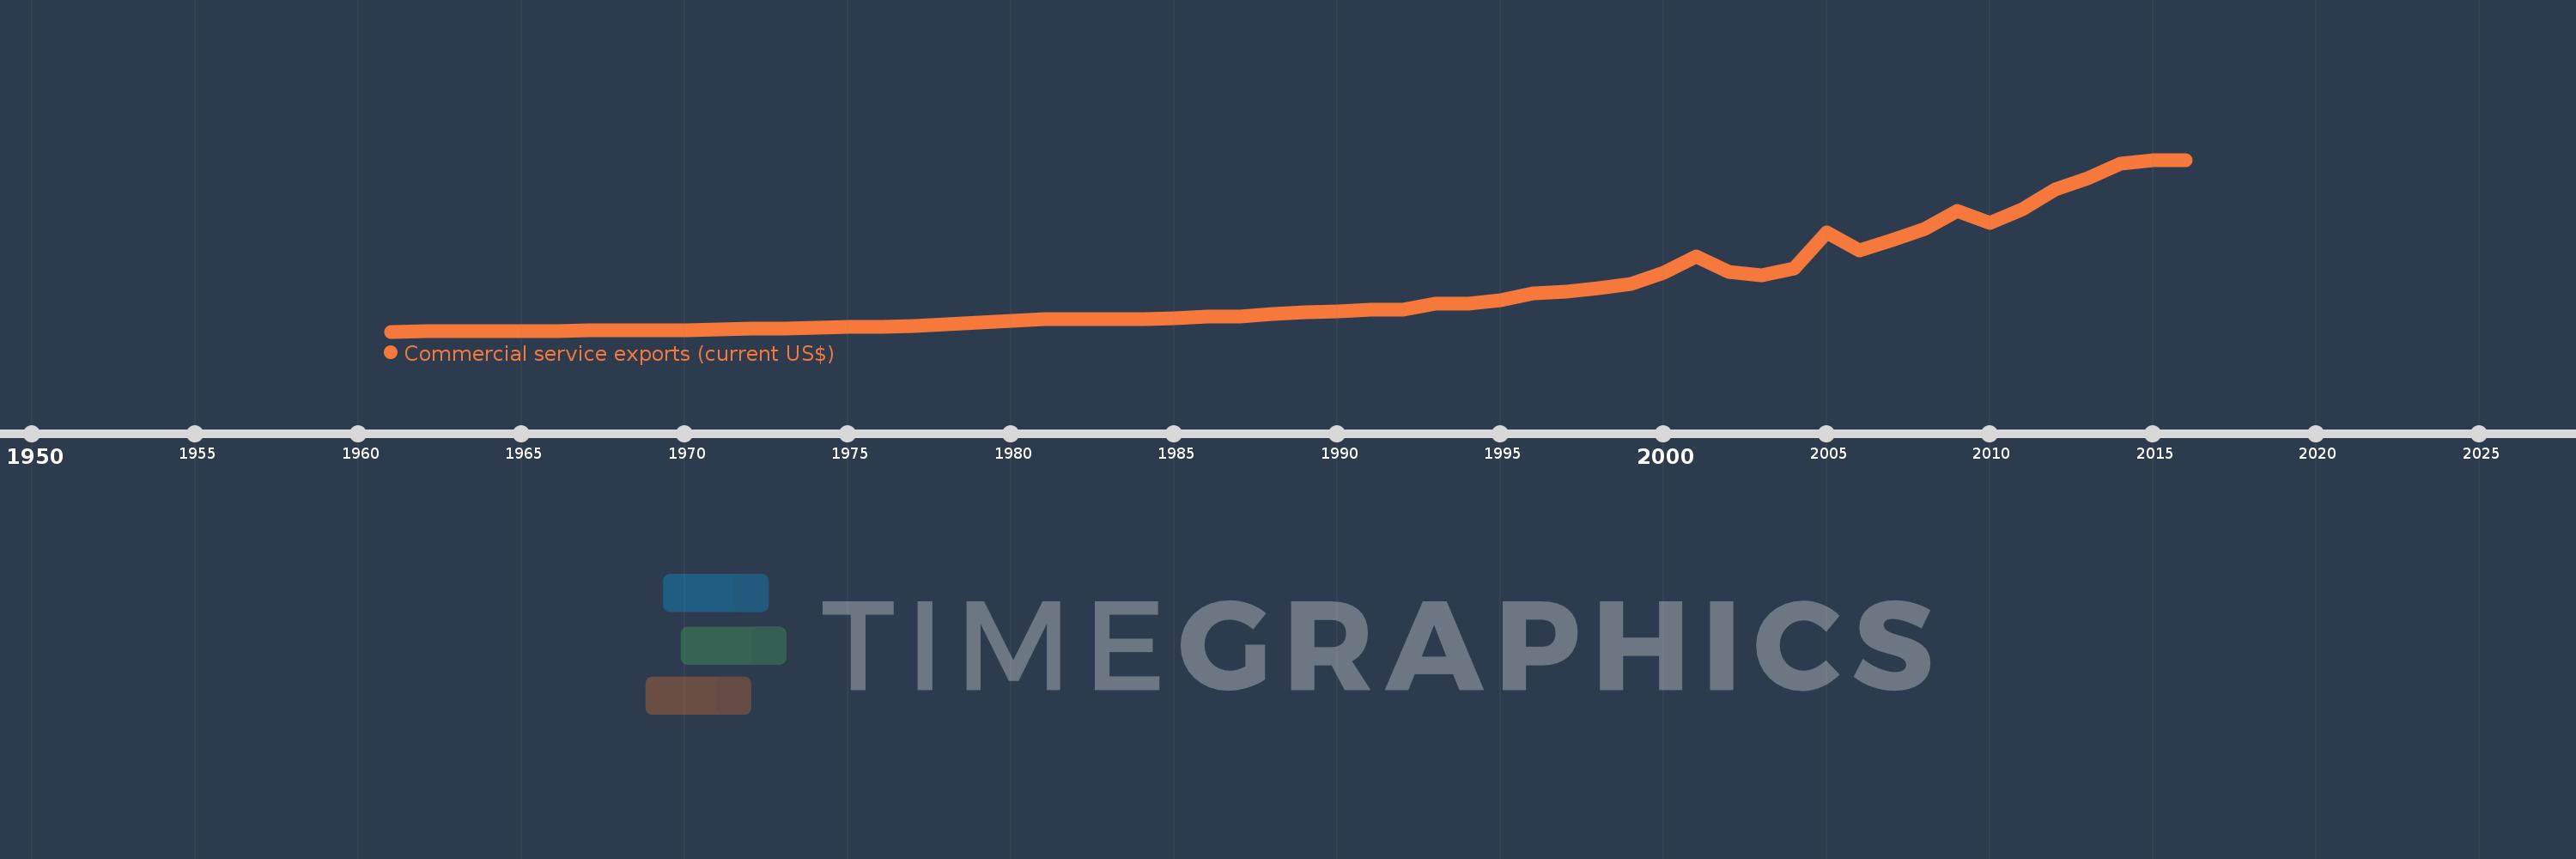
Commercial service exports (current US$)
2016,2015,2014,2013,2012,2011,2010,2009,2008,2007,2006,2005,2004,2003,2002,2001,2000,1999,1998,1997,1996,1995,1994,1993,1992,1991,1990,1989,1988,1987,1986,1985,1984,1983,1982,1981,1980,1979,1978,1977,1976,1975,1974,1973,1972,1971,1970,1969,1968,1967,1966,1962,1961
Cette statistique dans les autres pays:
AfghanistanAlbaniaAlgeriaAngolaAntigua and BarbudaArab WorldArgentinaArmeniaArubaAustraliaAustriaAzerbaijanBahamas, TheBahrainBangladeshBarbadosBelarusBelgiumBelizeBeninBermudaBhutanBoliviaBosnia and HerzegovinaBotswanaBrazilBrunei DarussalamBulgariaBurkina FasoBurundiCabo VerdeCambodiaCameroonCanadaCaribbean small statesCentral African RepublicCentral Europe and the BalticsChadChileChinaColombiaComorosCongo, Dem. Rep.Congo, Rep.Costa RicaCote d'IvoireCroatiaCuracaoCyprusCzech RepublicDenmarkDjiboutiDominicaDominican RepublicEarly-demographic dividendEast Asia & PacificEast Asia & Pacific (excluding high income)East Asia & Pacific (IDA & IBRD countries)EcuadorEgypt, Arab Rep.El SalvadorEquatorial GuineaEritreaEstoniaEthiopiaEuro areaEurope & Central AsiaEurope & Central Asia (excluding high income)Europe & Central Asia (IDA & IBRD countries)European UnionFaroe IslandsFijiFinlandFragile and conflict affected situationsFranceFrench PolynesiaGabonGambia, TheGeorgiaGermanyGhanaGreeceGrenadaGuatemalaGuineaGuinea-BissauGuyanaHaitiHeavily indebted poor countries (HIPC)High incomeHondurasHong Kong SAR, ChinaHungaryIBRD onlyIcelandIDA & IBRD totalIDA blendIDA onlyIDA totalIndiaIndonesiaIran, Islamic Rep.IraqIrelandIsraelItalyJamaicaJapanJordanKazakhstanKenyaKiribatiKorea, Rep.KosovoKuwaitKyrgyz RepublicLao PDRLate-demographic dividendLatin America & Caribbean Latin America & Caribbean (excluding high income)Latin America & the Caribbean (IDA & IBRD countries)LatviaLeast developed countries: UN classificationLebanonLesothoLiberiaLibyaLithuaniaLow & middle incomeLow incomeLower middle incomeLuxembourgMacao SAR, ChinaMacedonia, FYRMadagascarMalawiMalaysiaMaldivesMaliMaltaMarshall IslandsMauritaniaMauritiusMexicoMicronesia, Fed. Sts.Middle East & North Africa (excluding high income)Middle East & North Africa (IDA & IBRD countries)Middle incomeMoldovaMongoliaMontenegroMoroccoMozambiqueMyanmarNamibiaNepalNetherlandsNew CaledoniaNew ZealandNicaraguaNigerNigeriaNorth AmericaNorwayOECD membersOmanPacific island small statesPakistanPalauPanamaPapua New GuineaParaguayPeruPhilippinesPolandPortugalPost-demographic dividendPre-demographic dividendQatarRomaniaRussian FederationRwandaSamoaSao Tome and PrincipeSaudi ArabiaSenegalSerbiaSeychellesSierra LeoneSingaporeSint Maarten (Dutch part)Slovak RepublicSloveniaSolomon IslandsSouth AfricaSouth AsiaSouth Asia (IDA & IBRD)South SudanSpainSri LankaSt. Kitts and NevisSt. LuciaSt. Vincent and the GrenadinesSub-Saharan Africa Sub-Saharan Africa (excluding high income)Sub-Saharan Africa (IDA & IBRD countries)SudanSurinameSwazilandSwedenSwitzerlandSyrian Arab RepublicTajikistanTanzaniaThailandTimor-LesteTogoTongaTrinidad and TobagoTunisiaTurkeyTuvaluUgandaUkraineUnited KingdomUnited StatesUpper middle incomeUruguayVanuatuVenezuela, RBVietnamWest Bank and GazaWorldYemen, Rep.ZambiaZimbabwe La ligne de temps
Cette échelle de temps montre un graphique de 1961 année à 2016 année Israel. Les données jusqu'à 1960 année ne sont pas présentés. Quantité d'observations actuelles selon dates: 53.
Source (désignation):
Les indicateurs du développement mondiale
Source (organisation):
International Monetary Fund, Balance of Payments Statistics Yearbook and data files.
Catégories:
Private Sector, Trade
Dernière mise à jour
23 avr. 2017
Les indicateurs de changement de valeurs selon les années
Minimum:
89.0 mln.
1 janv. 1961
Maximum:
35.611 mds
1 janv. 2015
Pour la date d''observation
Valeur
Changement absolu
Le changement par rapport à la valeur précédente
1 janv. 1961
89.0 mln.
+89.0 mln.
0.0%
1 janv. 1962
113.0 mln.
+24.0 mln.
26.97%
1 janv. 1966
244.0 mln.
+131.0 mln.
115.93%
1 janv. 1967
276.0 mln.
+32.0 mln.
13.11%
1 janv. 1968
286.0 mln.
+10.0 mln.
3.62%
1 janv. 1969
392.0 mln.
+106.0 mln.
37.06%
1 janv. 1970
422.0 mln.
+30.0 mln.
7.65%
1 janv. 1971
468.0 mln.
+46.0 mln.
10.9%
1 janv. 1972
668.0 mln.
+200.0 mln.
42.74%
1 janv. 1973
700.0 mln.
+32.0 mln.
4.79%
1 janv. 1974
829.0 mln.
+129.0 mln.
18.43%
1 janv. 1975
1.114 mds
+285.0 mln.
34.38%
1 janv. 1976
1.102 mds
-12.0 mln.
-1.08%
1 janv. 1977
1.317 mds
+215.0 mln.
19.51%
1 janv. 1978
1.584 mds
+267.0 mln.
20.27%
1 janv. 1979
1.934 mds
+350.0 mln.
22.1%
1 janv. 1980
2.299 mds
+365.0 mln.
18.87%
1 janv. 1981
2.707 mds
+408.0 mln.
17.75%
1 janv. 1982
2.71 mds
+3.1 mln.
0.11%
1 janv. 1983
2.634 mds
-76.4 mln.
-2.82%
1 janv. 1984
2.739 mds
+105.7 mln.
4.01%
1 janv. 1985
2.815 mds
+75.2 mln.
2.75%
1 janv. 1986
3.155 mds
+340.7 mln.
12.1%
1 janv. 1987
3.121 mds
-33.9 mln.
-1.07%
1 janv. 1988
3.789 mds
+668.1 mln.
21.4%
1 janv. 1989
4.113 mds
+323.5 mln.
8.54%
1 janv. 1990
4.334 mds
+221.2 mln.
5.38%
1 janv. 1991
4.545 mds
+211.3 mln.
4.88%
1 janv. 1992
4.647 mds
+101.1 mln.
2.22%
1 janv. 1993
5.78 mds
+1.133 mds
24.39%
1 janv. 1994
5.94 mds
+159.7 mln.
2.76%
1 janv. 1995
6.548 mds
+608.7 mln.
10.25%
1 janv. 1996
7.906 mds
+1.357 mds
20.73%
1 janv. 1997
8.282 mds
+376.2 mln.
4.76%
1 janv. 1998
9.121 mds
+839.4 mln.
10.14%
1 janv. 1999
10.019 mds
+897.3 mln.
9.84%
1 janv. 2000
12.213 mds
+2.194 mds
21.9%
1 janv. 2001
15.619 mds
+3.406 mds
27.89%
1 janv. 2002
12.472 mds
-3.147 mds
-20.15%
1 janv. 2003
11.642 mds
-829.8 mln.
-6.65%
1 janv. 2004
13.057 mds
+1.415 mds
12.15%
1 janv. 2005
20.619 mds
+7.562 mds
57.92%
1 janv. 2006
16.831 mds
-3.788 mds
-18.37%
1 janv. 2007
19.02 mds
+2.189 mds
13.01%
1 janv. 2008
21.372 mds
+2.352 mds
12.37%
1 janv. 2009
25.009 mds
+3.636 mds
17.01%
1 janv. 2010
22.516 mds
-2.493 mds
-9.97%
1 janv. 2011
25.351 mds
+2.835 mds
12.59%
1 janv. 2012
29.424 mds
+4.073 mds
16.07%
1 janv. 2013
31.776 mds
+2.352 mds
7.99%
1 janv. 2014
34.879 mds
+3.103 mds
9.77%
1 janv. 2015
35.611 mds
+732.2 mln.
2.1%
1 janv. 2016
35.587 mds
-24.5 mln.
-0.07%
Classement des pays selon les statistiques actuelles par années


Commentaires: