29
/fr/
fr
AIzaSyAYiBZKx7MnpbEhh9jyipgxe19OcubqV5w
April 1, 2024
73627
Austria
AUT
true
2
1
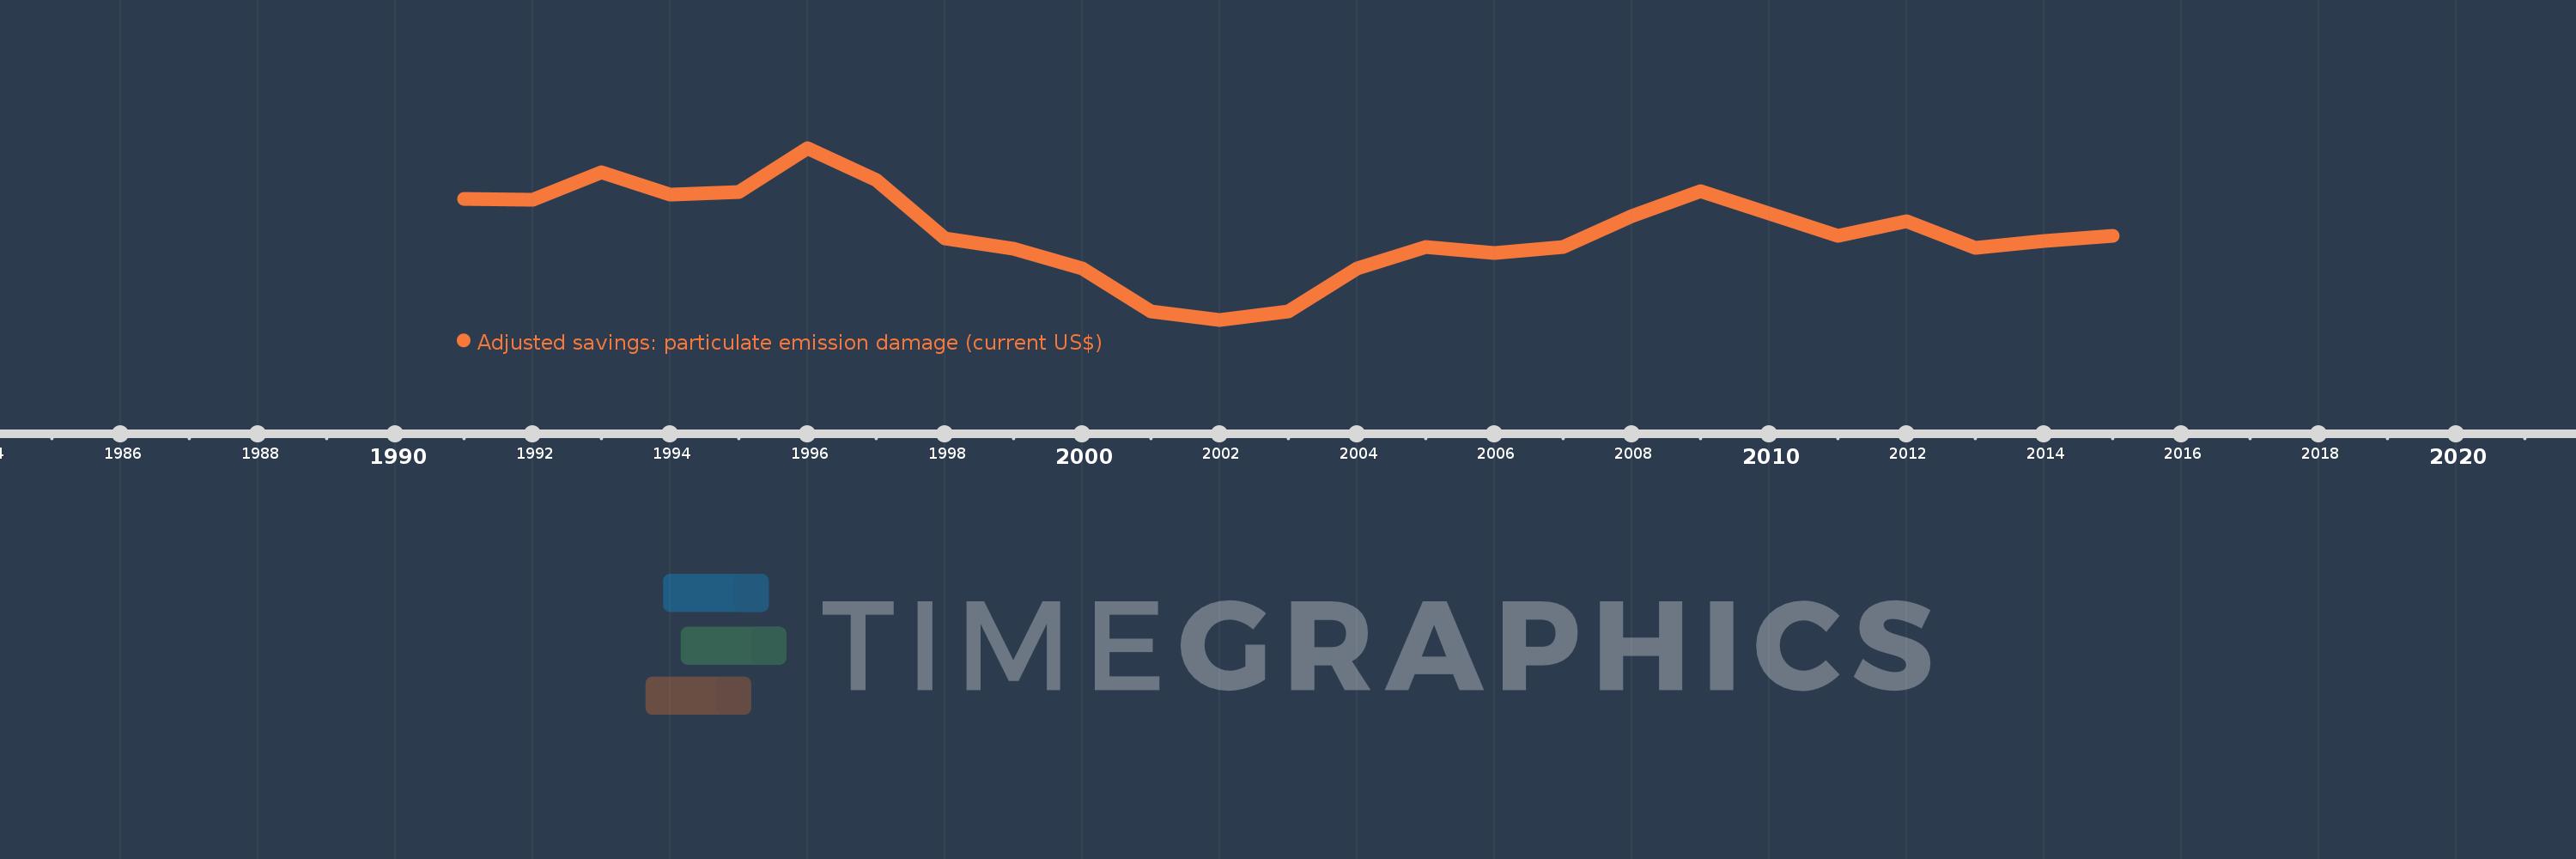
Adjusted savings: particulate emission damage (current US$)
2015,2014,2013,2012,2011,2010,2009,2008,2007,2006,2005,2004,2003,2002,2001,2000,1999,1998,1997,1996,1995,1994,1993,1992,1991
Cette statistique dans les autres pays:
AfghanistanAlbaniaAlgeriaAndorraAngolaAntigua and BarbudaArgentinaArmeniaAustraliaAustriaAzerbaijanBahamas, TheBahrainBangladeshBarbadosBelarusBelgiumBelizeBeninBhutanBoliviaBosnia and HerzegovinaBotswanaBrazilBrunei DarussalamBulgariaBurkina FasoBurundiCabo VerdeCambodiaCameroonCanadaCentral African RepublicChadChileChinaColombiaComorosCongo, Dem. Rep.Congo, Rep.Costa RicaCote d'IvoireCroatiaCubaCyprusCzech RepublicDenmarkDjiboutiDominicaDominican RepublicEcuadorEgypt, Arab Rep.El SalvadorEquatorial GuineaEritreaEstoniaEthiopiaFijiFinlandFranceGabonGambia, TheGeorgiaGermanyGhanaGreeceGrenadaGuatemalaGuineaGuinea-BissauGuyanaHaitiHondurasHong Kong SAR, ChinaHungaryIcelandIndiaIndonesiaIran, Islamic Rep.IraqIrelandIsraelItalyJamaicaJapanJordanKazakhstanKenyaKorea, Dem. People’s Rep.Korea, Rep.KuwaitKyrgyz RepublicLao PDRLatviaLebanonLesothoLiberiaLibyaLithuaniaLuxembourgMacao SAR, ChinaMacedonia, FYRMadagascarMalawiMalaysiaMaldivesMaliMaltaMauritaniaMauritiusMexicoMoldovaMonacoMongoliaMontenegroMoroccoMozambiqueMyanmarNamibiaNepalNetherlandsNew ZealandNicaraguaNigerNigeriaNorwayOmanPakistanPanamaPapua New GuineaParaguayPeruPhilippinesPolandPortugalPuerto RicoQatarRomaniaRussian FederationRwandaSan MarinoSao Tome and PrincipeSaudi ArabiaSenegalSerbiaSierra LeoneSingaporeSlovak RepublicSloveniaSolomon IslandsSomaliaSouth AfricaSpainSri LankaSt. Kitts and NevisSt. LuciaSt. Vincent and the GrenadinesSudanSurinameSwazilandSwedenSwitzerlandSyrian Arab RepublicTajikistanTanzaniaThailandTimor-LesteTogoTrinidad and TobagoTunisiaTurkeyTurkmenistanUgandaUkraineUnited Arab EmiratesUnited KingdomUnited StatesUruguayUzbekistanVanuatuVenezuela, RBVietnamWest Bank and GazaYemen, Rep.ZambiaZimbabwe La ligne de temps
Cette échelle de temps montre un graphique de 1991 année à 2015 année Austria. Les données jusqu'à 1990 année ne sont pas présentés. Quantité d'observations actuelles selon dates: 25.
Source (désignation):
Les indicateurs du développement mondiale
Source (organisation):
Data on health impacts from exposure to ambient PM2.5 pollution and household air pollution are from the Global Burden of Disease 2010 study. Data are provided by the Institute for Health Metrics and Evaluation at the University of Washington.
Catégories:
Economy & Growth, Environment
Dernière mise à jour
23 avr. 2017
Les indicateurs de changement de valeurs selon les années
Minimum:
428.577 mln.
1 janv. 2002
Maximum:
733.741 mln.
1 janv. 1996
Pour la date d''observation
Valeur
Changement absolu
Le changement par rapport à la valeur précédente
1 janv. 1991
642.834 mln.
+642.834 mln.
0.0%
1 janv. 1992
641.77 mln.
-1.065 mln.
-0.17%
1 janv. 1993
690.146 mln.
+48.376 mln.
7.54%
1 janv. 1994
651.096 mln.
-39.05 mln.
-5.66%
1 janv. 1995
655.639 mln.
+4.544 mln.
0.7%
1 janv. 1996
733.741 mln.
+78.101 mln.
11.91%
1 janv. 1997
677.576 mln.
-56.164 mln.
-7.65%
1 janv. 1998
573.677 mln.
-103.899 mln.
-15.33%
1 janv. 1999
554.826 mln.
-18.851 mln.
-3.29%
1 janv. 2000
520.295 mln.
-34.531 mln.
-6.22%
1 janv. 2001
442.915 mln.
-77.38 mln.
-14.87%
1 janv. 2002
428.577 mln.
-14.338 mln.
-3.24%
1 janv. 2003
443.274 mln.
+14.698 mln.
3.43%
1 janv. 2004
518.999 mln.
+75.725 mln.
17.08%
1 janv. 2005
558.569 mln.
+39.57 mln.
7.62%
1 janv. 2006
547.787 mln.
-10.782 mln.
-1.93%
1 janv. 2007
557.258 mln.
+9.471 mln.
1.73%
1 janv. 2008
612.658 mln.
+55.4 mln.
9.94%
1 janv. 2009
657.457 mln.
+44.799 mln.
7.31%
1 janv. 2010
616.888 mln.
-40.569 mln.
-6.17%
1 janv. 2011
577.496 mln.
-39.392 mln.
-6.39%
1 janv. 2012
604.111 mln.
+26.615 mln.
4.61%
1 janv. 2013
555.633 mln.
-48.478 mln.
-8.02%
1 janv. 2014
568.023 mln.
+12.39 mln.
2.23%
1 janv. 2015
577.294 mln.
+9.271 mln.
1.63%
Classement des pays selon les statistiques actuelles par années


Commentaires: