29
/fr/
fr
AIzaSyAYiBZKx7MnpbEhh9jyipgxe19OcubqV5w
April 1, 2024
143955
Guatemala
GTM
true
2
1
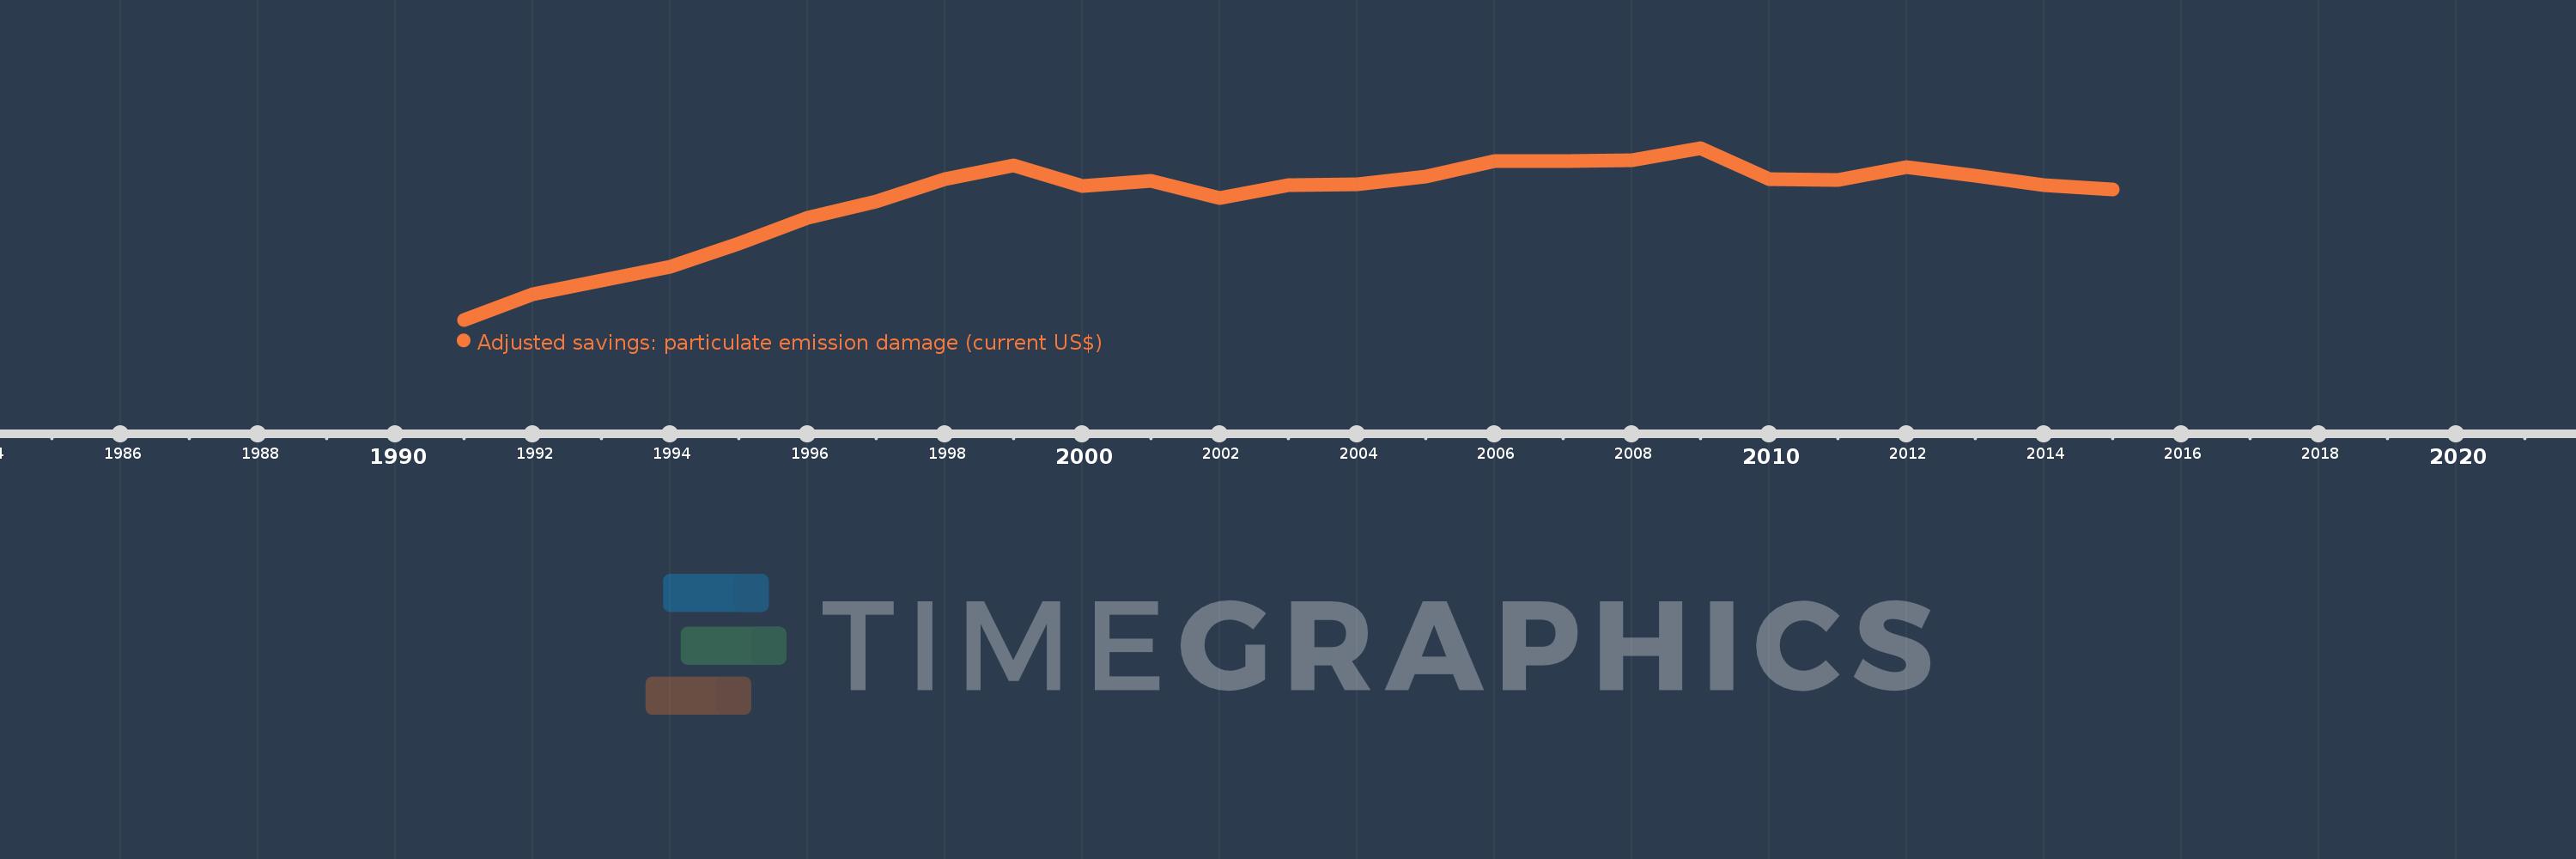
Adjusted savings: particulate emission damage (current US$)
2015,2014,2013,2012,2011,2010,2009,2008,2007,2006,2005,2004,2003,2002,2001,2000,1999,1998,1997,1996,1995,1994,1993,1992,1991
Cette statistique dans les autres pays:
AfghanistanAlbaniaAlgeriaAndorraAngolaAntigua and BarbudaArgentinaArmeniaAustraliaAustriaAzerbaijanBahamas, TheBahrainBangladeshBarbadosBelarusBelgiumBelizeBeninBhutanBoliviaBosnia and HerzegovinaBotswanaBrazilBrunei DarussalamBulgariaBurkina FasoBurundiCabo VerdeCambodiaCameroonCanadaCentral African RepublicChadChileChinaColombiaComorosCongo, Dem. Rep.Congo, Rep.Costa RicaCote d'IvoireCroatiaCubaCyprusCzech RepublicDenmarkDjiboutiDominicaDominican RepublicEcuadorEgypt, Arab Rep.El SalvadorEquatorial GuineaEritreaEstoniaEthiopiaFijiFinlandFranceGabonGambia, TheGeorgiaGermanyGhanaGreeceGrenadaGuatemalaGuineaGuinea-BissauGuyanaHaitiHondurasHong Kong SAR, ChinaHungaryIcelandIndiaIndonesiaIran, Islamic Rep.IraqIrelandIsraelItalyJamaicaJapanJordanKazakhstanKenyaKorea, Dem. People’s Rep.Korea, Rep.KuwaitKyrgyz RepublicLao PDRLatviaLebanonLesothoLiberiaLibyaLithuaniaLuxembourgMacao SAR, ChinaMacedonia, FYRMadagascarMalawiMalaysiaMaldivesMaliMaltaMauritaniaMauritiusMexicoMoldovaMonacoMongoliaMontenegroMoroccoMozambiqueMyanmarNamibiaNepalNetherlandsNew ZealandNicaraguaNigerNigeriaNorwayOmanPakistanPanamaPapua New GuineaParaguayPeruPhilippinesPolandPortugalPuerto RicoQatarRomaniaRussian FederationRwandaSan MarinoSao Tome and PrincipeSaudi ArabiaSenegalSerbiaSierra LeoneSingaporeSlovak RepublicSloveniaSolomon IslandsSomaliaSouth AfricaSpainSri LankaSt. Kitts and NevisSt. LuciaSt. Vincent and the GrenadinesSudanSurinameSwazilandSwedenSwitzerlandSyrian Arab RepublicTajikistanTanzaniaThailandTimor-LesteTogoTrinidad and TobagoTunisiaTurkeyTurkmenistanUgandaUkraineUnited Arab EmiratesUnited KingdomUnited StatesUruguayUzbekistanVanuatuVenezuela, RBVietnamWest Bank and GazaYemen, Rep.ZambiaZimbabwe La ligne de temps
Cette échelle de temps montre un graphique de 1991 année à 2015 année Guatemala. Les données jusqu'à 1990 année ne sont pas présentés. Quantité d'observations actuelles selon dates: 25.
Source (désignation):
Les indicateurs du développement mondiale
Source (organisation):
Data on health impacts from exposure to ambient PM2.5 pollution and household air pollution are from the Global Burden of Disease 2010 study. Data are provided by the Institute for Health Metrics and Evaluation at the University of Washington.
Catégories:
Economy & Growth, Environment
Dernière mise à jour
23 avr. 2017
Les indicateurs de changement de valeurs selon les années
Minimum:
94.793 mln.
1 janv. 1991
Maximum:
225.781 mln.
1 janv. 2009
Pour la date d''observation
Valeur
Changement absolu
Le changement par rapport à la valeur précédente
1 janv. 1991
94.793 mln.
+94.793 mln.
0.0%
1 janv. 1992
114.492 mln.
+19.699 mln.
20.78%
1 janv. 1993
124.951 mln.
+10.459 mln.
9.13%
1 janv. 1994
135.375 mln.
+10.425 mln.
8.34%
1 janv. 1995
152.836 mln.
+17.461 mln.
12.9%
1 janv. 1996
172.829 mln.
+19.993 mln.
13.08%
1 janv. 1997
185.266 mln.
+12.437 mln.
7.2%
1 janv. 1998
202.225 mln.
+16.959 mln.
9.15%
1 janv. 1999
212.764 mln.
+10.539 mln.
5.21%
1 janv. 2000
196.938 mln.
-15.826 mln.
-7.44%
1 janv. 2001
200.971 mln.
+4.033 mln.
2.05%
1 janv. 2002
187.898 mln.
-13.073 mln.
-6.5%
1 janv. 2003
197.471 mln.
+9.573 mln.
5.09%
1 janv. 2004
198.225 mln.
+754.17 milles
0.38%
1 janv. 2005
203.953 mln.
+5.728 mln.
2.89%
1 janv. 2006
215.642 mln.
+11.689 mln.
5.73%
1 janv. 2007
215.991 mln.
+349.254 milles
0.16%
1 janv. 2008
216.503 mln.
+512.012 milles
0.24%
1 janv. 2009
225.781 mln.
+9.277 mln.
4.29%
1 janv. 2010
201.997 mln.
-23.783 mln.
-10.53%
1 janv. 2011
201.471 mln.
-525.914 milles
-0.26%
1 janv. 2012
211.434 mln.
+9.963 mln.
4.95%
1 janv. 2013
204.873 mln.
-6.561 mln.
-3.1%
1 janv. 2014
197.636 mln.
-7.237 mln.
-3.53%
1 janv. 2015
194.303 mln.
-3.333 mln.
-1.69%
Classement des pays selon les statistiques actuelles par années


Commentaires: