29
/fr/
fr
AIzaSyAYiBZKx7MnpbEhh9jyipgxe19OcubqV5w
April 1, 2024
103243
Chad
TCD
true
2
1
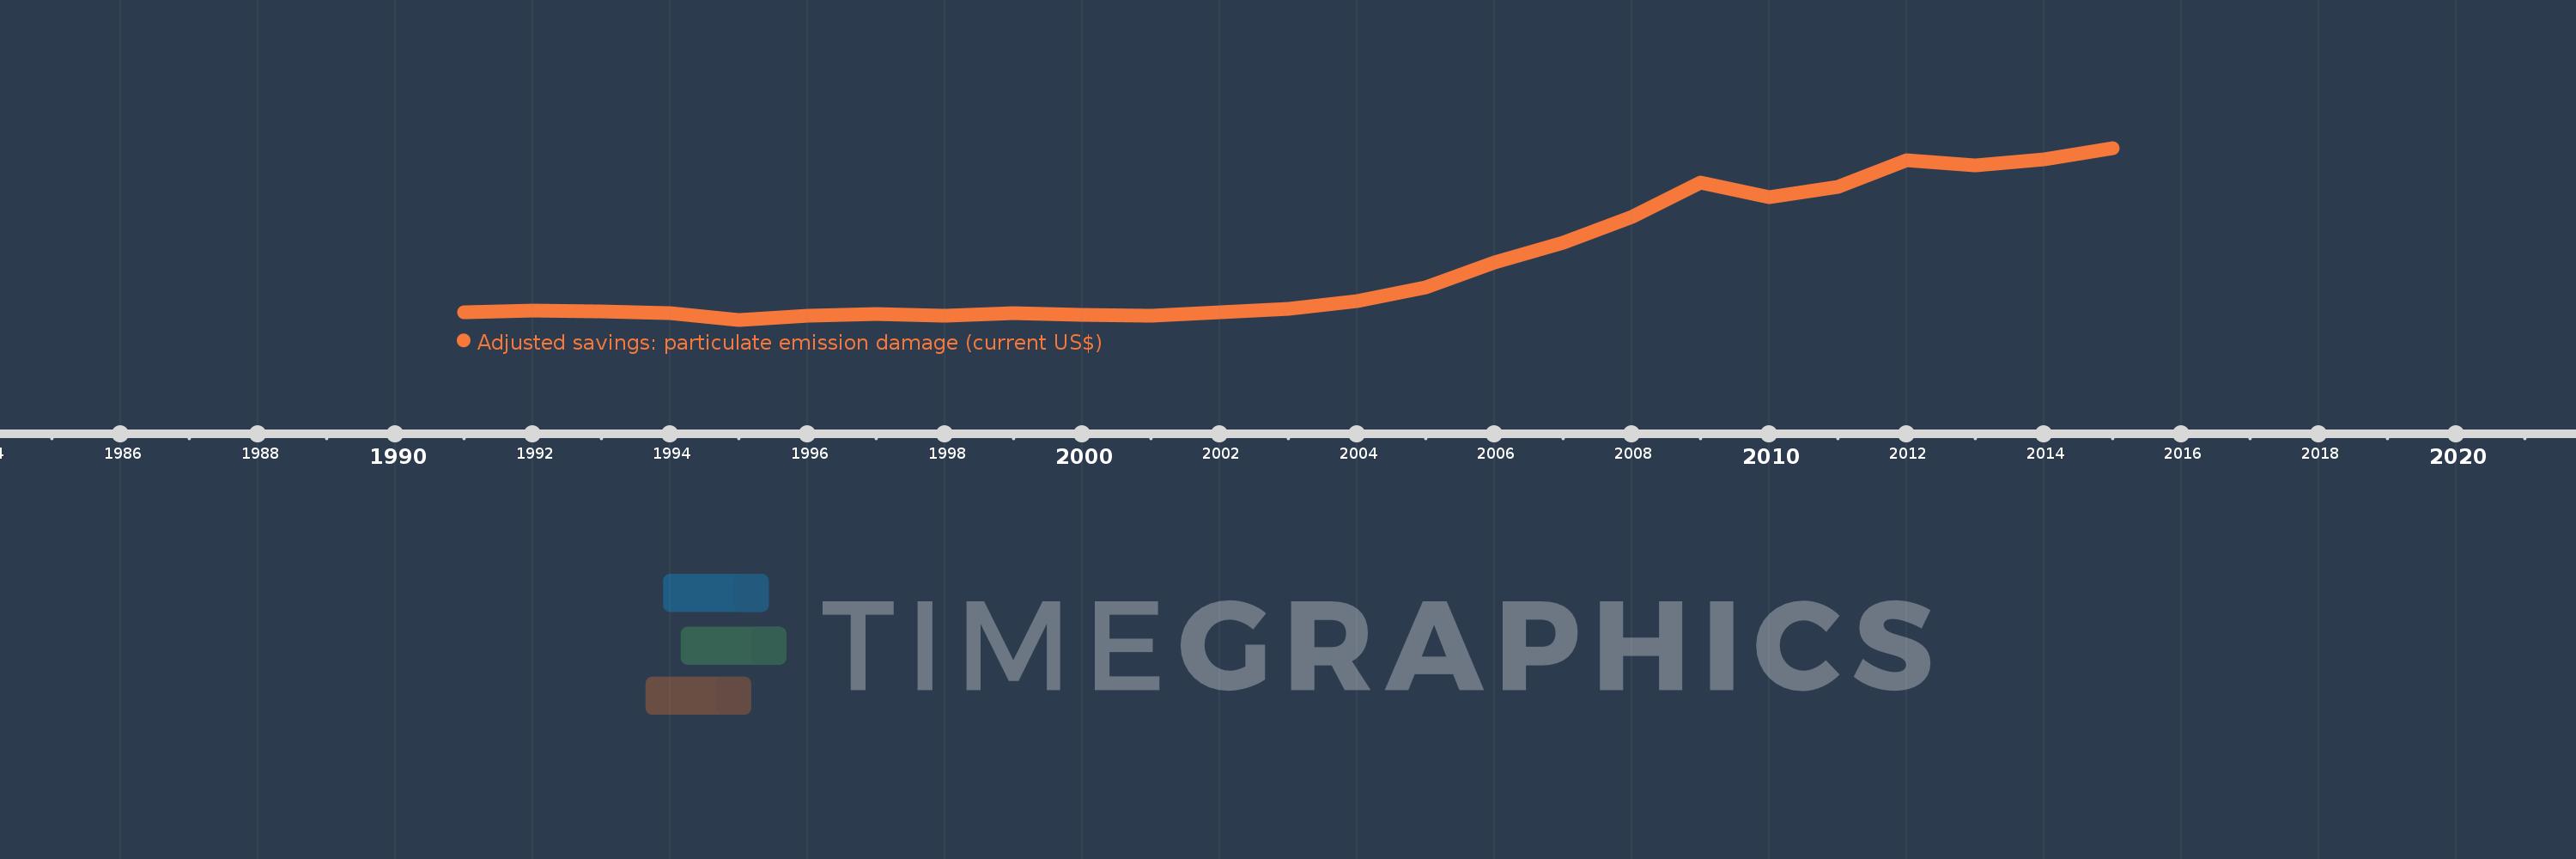
Adjusted savings: particulate emission damage (current US$)
2015,2014,2013,2012,2011,2010,2009,2008,2007,2006,2005,2004,2003,2002,2001,2000,1999,1998,1997,1996,1995,1994,1993,1992,1991
Cette statistique dans les autres pays:
AfghanistanAlbaniaAlgeriaAndorraAngolaAntigua and BarbudaArgentinaArmeniaAustraliaAustriaAzerbaijanBahamas, TheBahrainBangladeshBarbadosBelarusBelgiumBelizeBeninBhutanBoliviaBosnia and HerzegovinaBotswanaBrazilBrunei DarussalamBulgariaBurkina FasoBurundiCabo VerdeCambodiaCameroonCanadaCentral African RepublicChadChileChinaColombiaComorosCongo, Dem. Rep.Congo, Rep.Costa RicaCote d'IvoireCroatiaCubaCyprusCzech RepublicDenmarkDjiboutiDominicaDominican RepublicEcuadorEgypt, Arab Rep.El SalvadorEquatorial GuineaEritreaEstoniaEthiopiaFijiFinlandFranceGabonGambia, TheGeorgiaGermanyGhanaGreeceGrenadaGuatemalaGuineaGuinea-BissauGuyanaHaitiHondurasHong Kong SAR, ChinaHungaryIcelandIndiaIndonesiaIran, Islamic Rep.IraqIrelandIsraelItalyJamaicaJapanJordanKazakhstanKenyaKorea, Dem. People’s Rep.Korea, Rep.KuwaitKyrgyz RepublicLao PDRLatviaLebanonLesothoLiberiaLibyaLithuaniaLuxembourgMacao SAR, ChinaMacedonia, FYRMadagascarMalawiMalaysiaMaldivesMaliMaltaMauritaniaMauritiusMexicoMoldovaMonacoMongoliaMontenegroMoroccoMozambiqueMyanmarNamibiaNepalNetherlandsNew ZealandNicaraguaNigerNigeriaNorwayOmanPakistanPanamaPapua New GuineaParaguayPeruPhilippinesPolandPortugalPuerto RicoQatarRomaniaRussian FederationRwandaSan MarinoSao Tome and PrincipeSaudi ArabiaSenegalSerbiaSierra LeoneSingaporeSlovak RepublicSloveniaSolomon IslandsSomaliaSouth AfricaSpainSri LankaSt. Kitts and NevisSt. LuciaSt. Vincent and the GrenadinesSudanSurinameSwazilandSwedenSwitzerlandSyrian Arab RepublicTajikistanTanzaniaThailandTimor-LesteTogoTrinidad and TobagoTunisiaTurkeyTurkmenistanUgandaUkraineUnited Arab EmiratesUnited KingdomUnited StatesUruguayUzbekistanVanuatuVenezuela, RBVietnamWest Bank and GazaYemen, Rep.ZambiaZimbabwe La ligne de temps
Cette échelle de temps montre un graphique de 1991 année à 2015 année Chad. Les données jusqu'à 1990 année ne sont pas présentés. Quantité d'observations actuelles selon dates: 25.
Source (désignation):
Les indicateurs du développement mondiale
Source (organisation):
Data on health impacts from exposure to ambient PM2.5 pollution and household air pollution are from the Global Burden of Disease 2010 study. Data are provided by the Institute for Health Metrics and Evaluation at the University of Washington.
Catégories:
Economy & Growth, Environment
Dernière mise à jour
23 avr. 2017
Les indicateurs de changement de valeurs selon les années
Minimum:
36.63 mln.
1 janv. 1995
Maximum:
393.839 mln.
1 janv. 2015
Pour la date d''observation
Valeur
Changement absolu
Le changement par rapport à la valeur précédente
1 janv. 1991
52.59 mln.
+52.59 mln.
0.0%
1 janv. 1992
55.978 mln.
+3.388 mln.
6.44%
1 janv. 1993
54.498 mln.
-1.48 mln.
-2.64%
1 janv. 1994
49.502 mln.
-4.996 mln.
-9.17%
1 janv. 1995
36.63 mln.
-12.872 mln.
-26.0%
1 janv. 1996
44.666 mln.
+8.036 mln.
21.94%
1 janv. 1997
49.005 mln.
+4.34 mln.
9.72%
1 janv. 1998
45.182 mln.
-3.824 mln.
-7.8%
1 janv. 1999
51.073 mln.
+5.891 mln.
13.04%
1 janv. 2000
47.061 mln.
-4.012 mln.
-7.86%
1 janv. 2001
45.113 mln.
-1.948 mln.
-4.14%
1 janv. 2002
52.38 mln.
+7.267 mln.
16.11%
1 janv. 2003
59.123 mln.
+6.743 mln.
12.87%
1 janv. 2004
75.803 mln.
+16.68 mln.
28.21%
1 janv. 2005
104.057 mln.
+28.254 mln.
37.27%
1 janv. 2006
155.754 mln.
+51.698 mln.
49.68%
1 janv. 2007
197.028 mln.
+41.274 mln.
26.5%
1 janv. 2008
250.274 mln.
+53.246 mln.
27.02%
1 janv. 2009
322.474 mln.
+72.2 mln.
28.85%
1 janv. 2010
291.235 mln.
-31.239 mln.
-9.69%
1 janv. 2011
313.674 mln.
+22.439 mln.
7.7%
1 janv. 2012
367.886 mln.
+54.212 mln.
17.28%
1 janv. 2013
357.504 mln.
-10.382 mln.
-2.82%
1 janv. 2014
370.254 mln.
+12.75 mln.
3.57%
1 janv. 2015
393.839 mln.
+23.585 mln.
6.37%
Classement des pays selon les statistiques actuelles par années


Commentaires: