29
/fr/
fr
AIzaSyAYiBZKx7MnpbEhh9jyipgxe19OcubqV5w
April 1, 2024
225585
Portugal
PRT
true
2
1
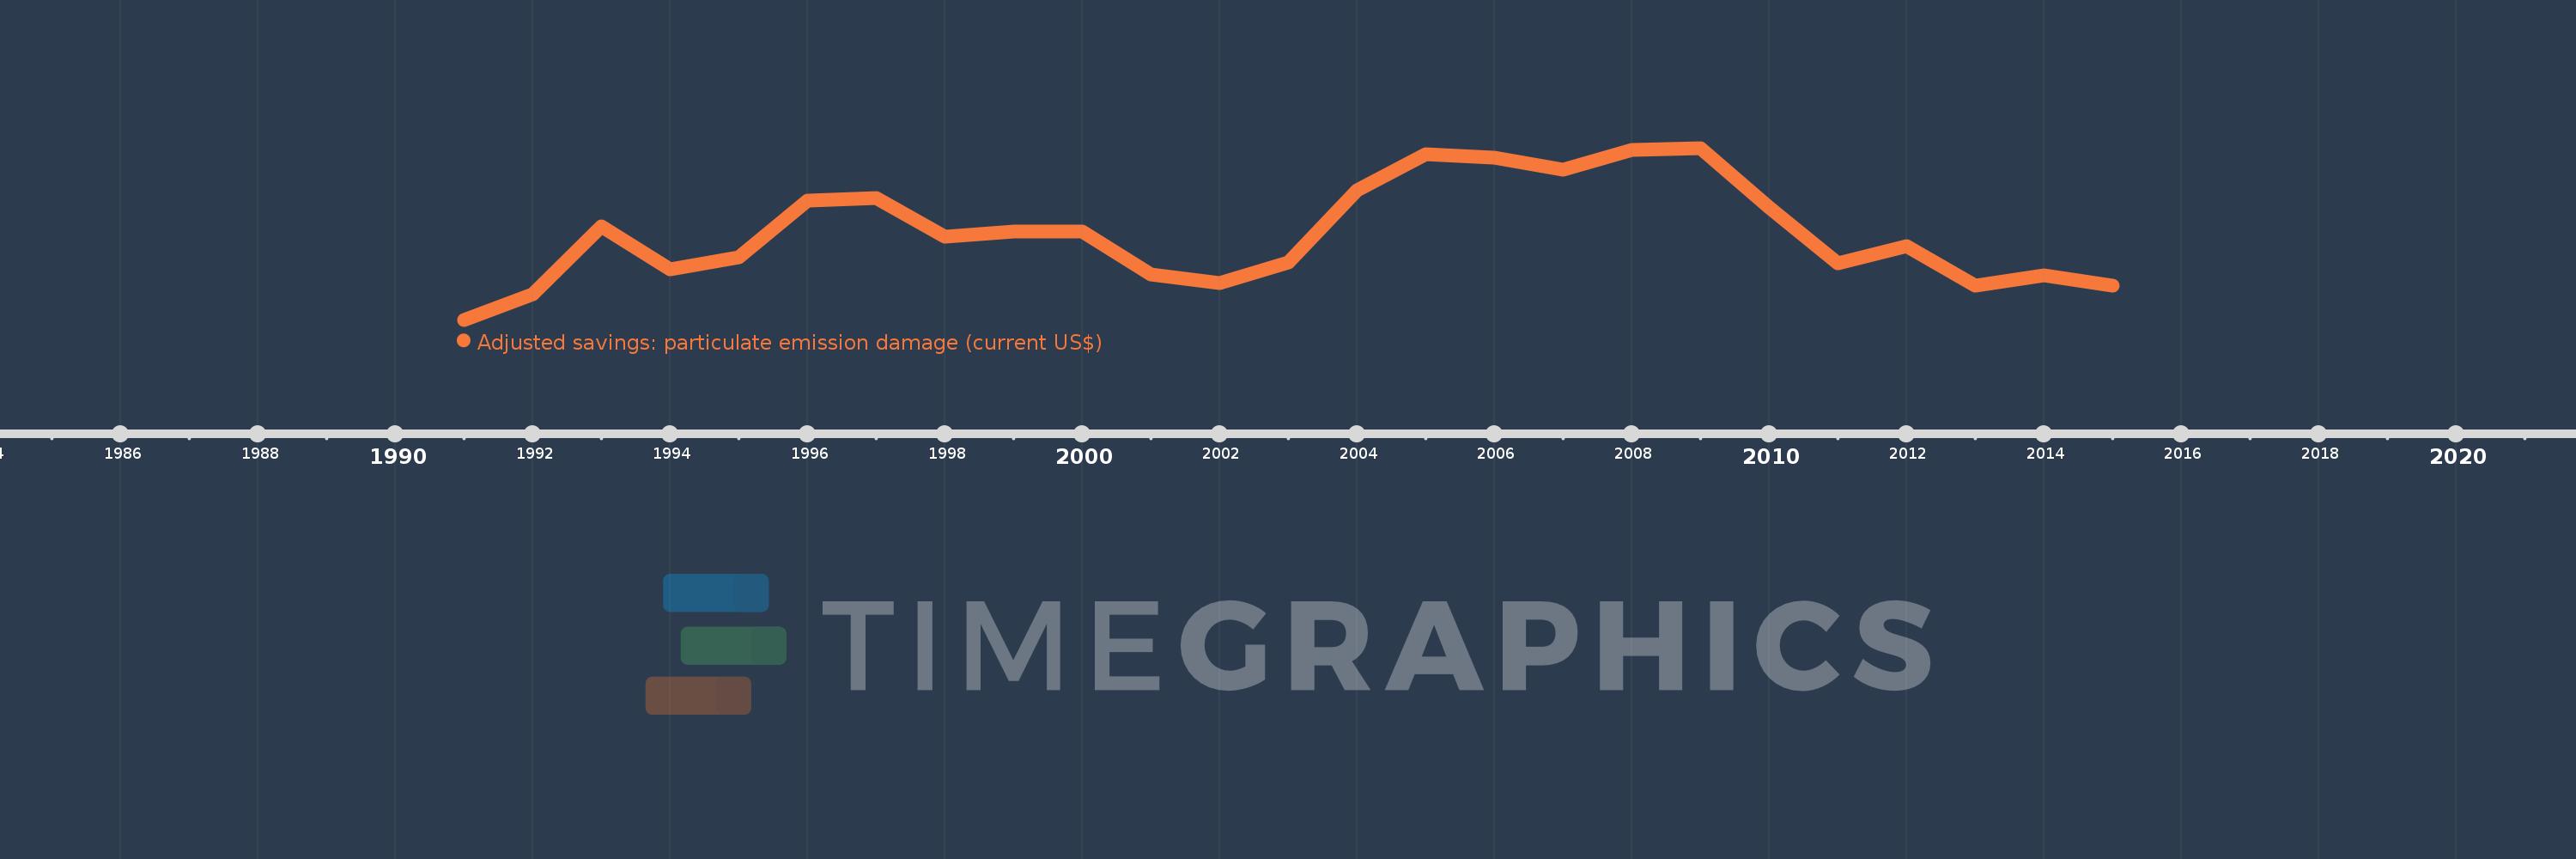
Adjusted savings: particulate emission damage (current US$)
2015,2014,2013,2012,2011,2010,2009,2008,2007,2006,2005,2004,2003,2002,2001,2000,1999,1998,1997,1996,1995,1994,1993,1992,1991
Cette statistique dans les autres pays:
AfghanistanAlbaniaAlgeriaAndorraAngolaAntigua and BarbudaArgentinaArmeniaAustraliaAustriaAzerbaijanBahamas, TheBahrainBangladeshBarbadosBelarusBelgiumBelizeBeninBhutanBoliviaBosnia and HerzegovinaBotswanaBrazilBrunei DarussalamBulgariaBurkina FasoBurundiCabo VerdeCambodiaCameroonCanadaCentral African RepublicChadChileChinaColombiaComorosCongo, Dem. Rep.Congo, Rep.Costa RicaCote d'IvoireCroatiaCubaCyprusCzech RepublicDenmarkDjiboutiDominicaDominican RepublicEcuadorEgypt, Arab Rep.El SalvadorEquatorial GuineaEritreaEstoniaEthiopiaFijiFinlandFranceGabonGambia, TheGeorgiaGermanyGhanaGreeceGrenadaGuatemalaGuineaGuinea-BissauGuyanaHaitiHondurasHong Kong SAR, ChinaHungaryIcelandIndiaIndonesiaIran, Islamic Rep.IraqIrelandIsraelItalyJamaicaJapanJordanKazakhstanKenyaKorea, Dem. People’s Rep.Korea, Rep.KuwaitKyrgyz RepublicLao PDRLatviaLebanonLesothoLiberiaLibyaLithuaniaLuxembourgMacao SAR, ChinaMacedonia, FYRMadagascarMalawiMalaysiaMaldivesMaliMaltaMauritaniaMauritiusMexicoMoldovaMonacoMongoliaMontenegroMoroccoMozambiqueMyanmarNamibiaNepalNetherlandsNew ZealandNicaraguaNigerNigeriaNorwayOmanPakistanPanamaPapua New GuineaParaguayPeruPhilippinesPolandPortugalPuerto RicoQatarRomaniaRussian FederationRwandaSan MarinoSao Tome and PrincipeSaudi ArabiaSenegalSerbiaSierra LeoneSingaporeSlovak RepublicSloveniaSolomon IslandsSomaliaSouth AfricaSpainSri LankaSt. Kitts and NevisSt. LuciaSt. Vincent and the GrenadinesSudanSurinameSwazilandSwedenSwitzerlandSyrian Arab RepublicTajikistanTanzaniaThailandTimor-LesteTogoTrinidad and TobagoTunisiaTurkeyTurkmenistanUgandaUkraineUnited Arab EmiratesUnited KingdomUnited StatesUruguayUzbekistanVanuatuVenezuela, RBVietnamWest Bank and GazaYemen, Rep.ZambiaZimbabwe La ligne de temps
Cette échelle de temps montre un graphique de 1991 année à 2015 année Portugal. Les données jusqu'à 1990 année ne sont pas présentés. Quantité d'observations actuelles selon dates: 25.
Source (désignation):
Les indicateurs du développement mondiale
Source (organisation):
Data on health impacts from exposure to ambient PM2.5 pollution and household air pollution are from the Global Burden of Disease 2010 study. Data are provided by the Institute for Health Metrics and Evaluation at the University of Washington.
Catégories:
Economy & Growth, Environment
Dernière mise à jour
23 avr. 2017
Les indicateurs de changement de valeurs selon les années
Minimum:
243.053 mln.
1 janv. 1991
Maximum:
376.079 mln.
1 janv. 2009
Pour la date d''observation
Valeur
Changement absolu
Le changement par rapport à la valeur précédente
1 janv. 1991
243.053 mln.
+243.053 mln.
0.0%
1 janv. 1992
262.992 mln.
+19.939 mln.
8.2%
1 janv. 1993
315.181 mln.
+52.189 mln.
19.84%
1 janv. 1994
282.217 mln.
-32.963 mln.
-10.46%
1 janv. 1995
291.621 mln.
+9.404 mln.
3.33%
1 janv. 1996
335.254 mln.
+43.633 mln.
14.96%
1 janv. 1997
337.565 mln.
+2.311 mln.
0.69%
1 janv. 1998
307.616 mln.
-29.949 mln.
-8.87%
1 janv. 1999
311.26 mln.
+3.645 mln.
1.18%
1 janv. 2000
311.623 mln.
+362.531 milles
0.12%
1 janv. 2001
278.078 mln.
-33.545 mln.
-10.76%
1 janv. 2002
271.213 mln.
-6.865 mln.
-2.47%
1 janv. 2003
287.441 mln.
+16.228 mln.
5.98%
1 janv. 2004
343.591 mln.
+56.15 mln.
19.53%
1 janv. 2005
371.155 mln.
+27.564 mln.
8.02%
1 janv. 2006
368.811 mln.
-2.343 mln.
-0.63%
1 janv. 2007
359.375 mln.
-9.436 mln.
-2.56%
1 janv. 2008
374.794 mln.
+15.419 mln.
4.29%
1 janv. 2009
376.079 mln.
+1.285 mln.
0.34%
1 janv. 2010
330.04 mln.
-46.039 mln.
-12.24%
1 janv. 2011
286.599 mln.
-43.441 mln.
-13.16%
1 janv. 2012
300.023 mln.
+13.424 mln.
4.68%
1 janv. 2013
269.531 mln.
-30.492 mln.
-10.16%
1 janv. 2014
277.201 mln.
+7.67 mln.
2.85%
1 janv. 2015
269.206 mln.
-7.995 mln.
-2.88%
Classement des pays selon les statistiques actuelles par années


Commentaires: