29
/fr/
fr
AIzaSyAYiBZKx7MnpbEhh9jyipgxe19OcubqV5w
April 1, 2024
117600
Czech Republic
CZE
true
2
1
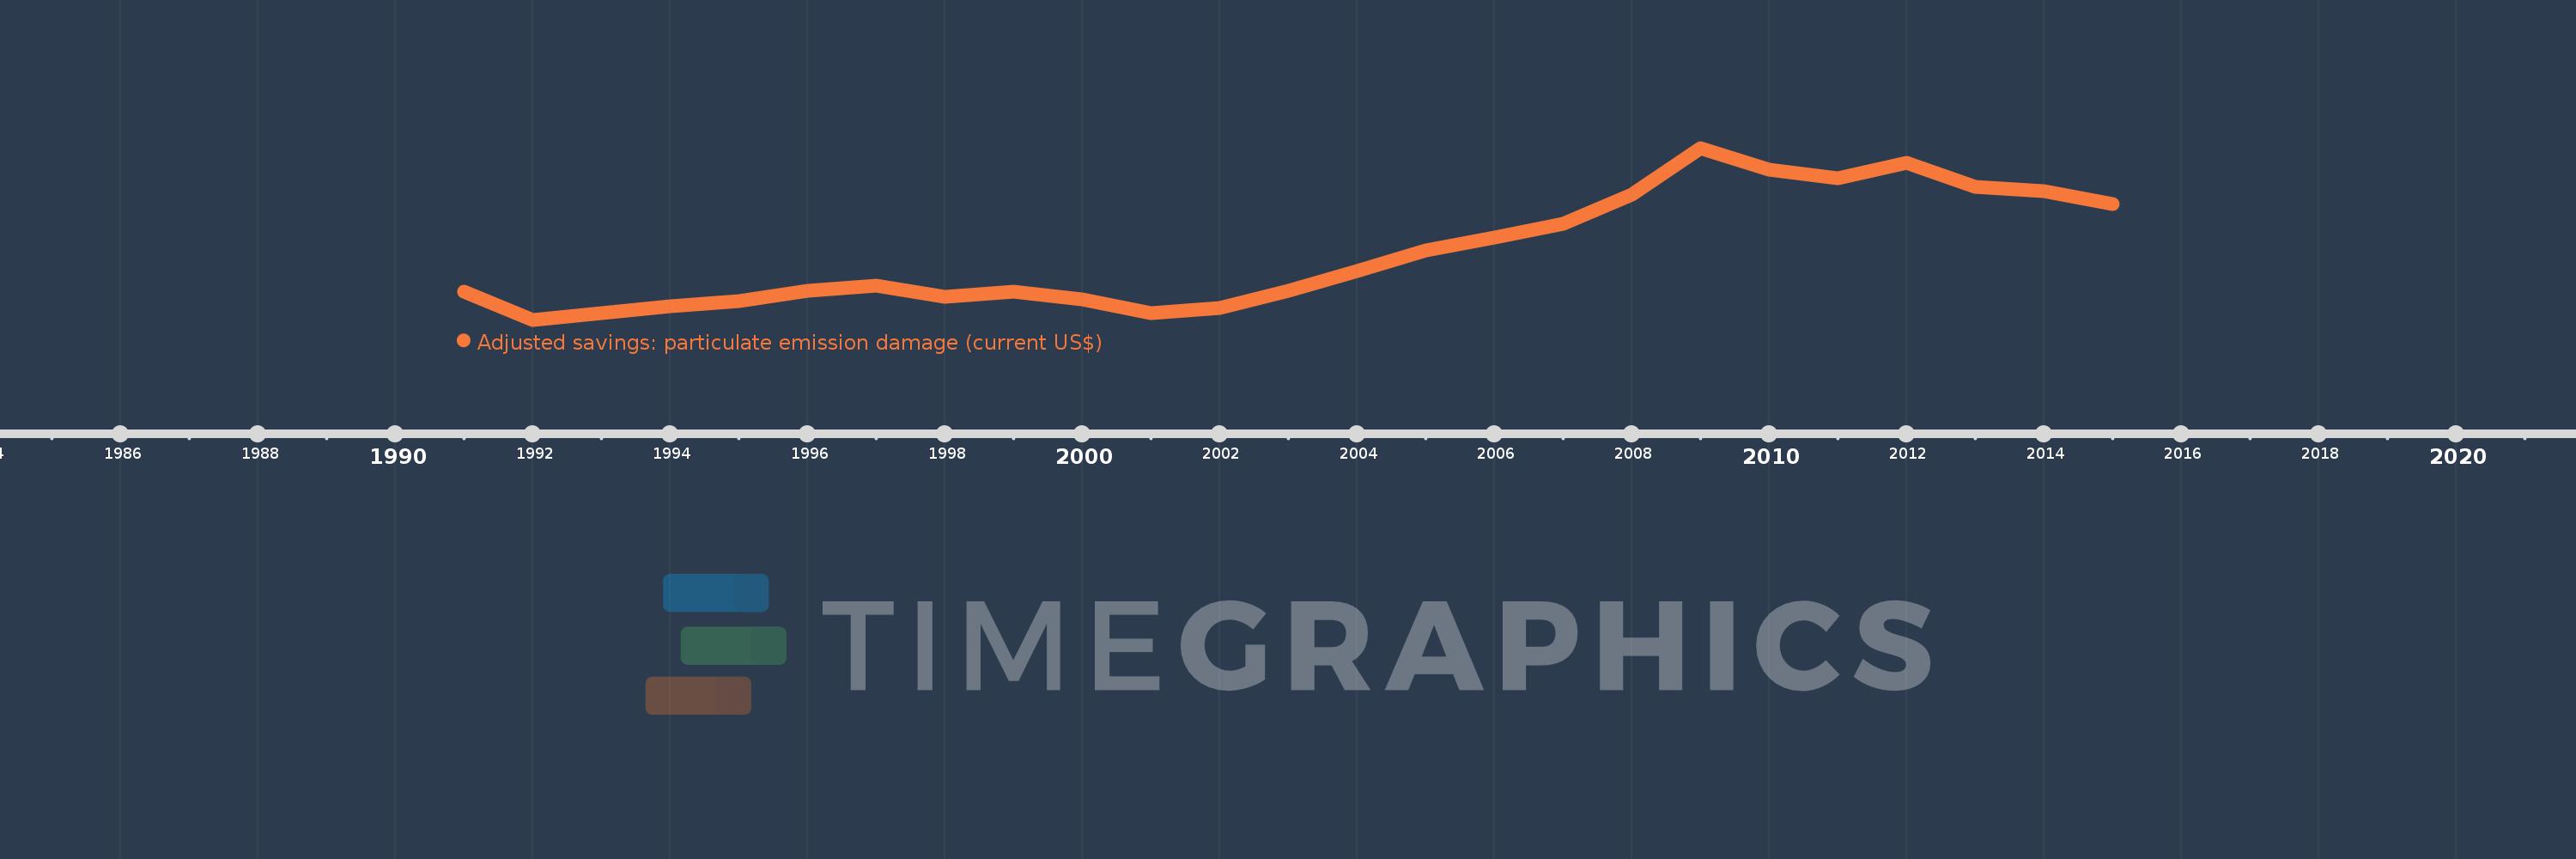
Adjusted savings: particulate emission damage (current US$)
2015,2014,2013,2012,2011,2010,2009,2008,2007,2006,2005,2004,2003,2002,2001,2000,1999,1998,1997,1996,1995,1994,1993,1992,1991
Cette statistique dans les autres pays:
AfghanistanAlbaniaAlgeriaAndorraAngolaAntigua and BarbudaArgentinaArmeniaAustraliaAustriaAzerbaijanBahamas, TheBahrainBangladeshBarbadosBelarusBelgiumBelizeBeninBhutanBoliviaBosnia and HerzegovinaBotswanaBrazilBrunei DarussalamBulgariaBurkina FasoBurundiCabo VerdeCambodiaCameroonCanadaCentral African RepublicChadChileChinaColombiaComorosCongo, Dem. Rep.Congo, Rep.Costa RicaCote d'IvoireCroatiaCubaCyprusCzech RepublicDenmarkDjiboutiDominicaDominican RepublicEcuadorEgypt, Arab Rep.El SalvadorEquatorial GuineaEritreaEstoniaEthiopiaFijiFinlandFranceGabonGambia, TheGeorgiaGermanyGhanaGreeceGrenadaGuatemalaGuineaGuinea-BissauGuyanaHaitiHondurasHong Kong SAR, ChinaHungaryIcelandIndiaIndonesiaIran, Islamic Rep.IraqIrelandIsraelItalyJamaicaJapanJordanKazakhstanKenyaKorea, Dem. People’s Rep.Korea, Rep.KuwaitKyrgyz RepublicLao PDRLatviaLebanonLesothoLiberiaLibyaLithuaniaLuxembourgMacao SAR, ChinaMacedonia, FYRMadagascarMalawiMalaysiaMaldivesMaliMaltaMauritaniaMauritiusMexicoMoldovaMonacoMongoliaMontenegroMoroccoMozambiqueMyanmarNamibiaNepalNetherlandsNew ZealandNicaraguaNigerNigeriaNorwayOmanPakistanPanamaPapua New GuineaParaguayPeruPhilippinesPolandPortugalPuerto RicoQatarRomaniaRussian FederationRwandaSan MarinoSao Tome and PrincipeSaudi ArabiaSenegalSerbiaSierra LeoneSingaporeSlovak RepublicSloveniaSolomon IslandsSomaliaSouth AfricaSpainSri LankaSt. Kitts and NevisSt. LuciaSt. Vincent and the GrenadinesSudanSurinameSwazilandSwedenSwitzerlandSyrian Arab RepublicTajikistanTanzaniaThailandTimor-LesteTogoTrinidad and TobagoTunisiaTurkeyTurkmenistanUgandaUkraineUnited Arab EmiratesUnited KingdomUnited StatesUruguayUzbekistanVanuatuVenezuela, RBVietnamWest Bank and GazaYemen, Rep.ZambiaZimbabwe La ligne de temps
Cette échelle de temps montre un graphique de 1991 année à 2015 année Czech Republic. Les données jusqu'à 1990 année ne sont pas présentés. Quantité d'observations actuelles selon dates: 25.
Source (désignation):
Les indicateurs du développement mondiale
Source (organisation):
Data on health impacts from exposure to ambient PM2.5 pollution and household air pollution are from the Global Burden of Disease 2010 study. Data are provided by the Institute for Health Metrics and Evaluation at the University of Washington.
Catégories:
Economy & Growth, Environment
Dernière mise à jour
23 avr. 2017
Les indicateurs de changement de valeurs selon les années
Minimum:
192.489 mln.
1 janv. 1992
Maximum:
614.806 mln.
1 janv. 2009
Pour la date d''observation
Valeur
Changement absolu
Le changement par rapport à la valeur précédente
1 janv. 1991
262.214 mln.
+262.214 mln.
0.0%
1 janv. 1992
192.489 mln.
-69.724 mln.
-26.59%
1 janv. 1993
208.548 mln.
+16.059 mln.
8.34%
1 janv. 1994
225.804 mln.
+17.256 mln.
8.27%
1 janv. 1995
238.49 mln.
+12.686 mln.
5.62%
1 janv. 1996
262.88 mln.
+24.391 mln.
10.23%
1 janv. 1997
276.042 mln.
+13.162 mln.
5.01%
1 janv. 1998
249.796 mln.
-26.246 mln.
-9.51%
1 janv. 1999
260.551 mln.
+10.755 mln.
4.31%
1 janv. 2000
243.053 mln.
-17.497 mln.
-6.72%
1 janv. 2001
208.882 mln.
-34.171 mln.
-14.06%
1 janv. 2002
222.178 mln.
+13.296 mln.
6.37%
1 janv. 2003
263.276 mln.
+41.098 mln.
18.5%
1 janv. 2004
313.14 mln.
+49.864 mln.
18.94%
1 janv. 2005
362.09 mln.
+48.95 mln.
15.63%
1 janv. 2006
395.207 mln.
+33.117 mln.
9.15%
1 janv. 2007
427.314 mln.
+32.107 mln.
8.12%
1 janv. 2008
500.371 mln.
+73.057 mln.
17.1%
1 janv. 2009
614.806 mln.
+114.435 mln.
22.87%
1 janv. 2010
560.422 mln.
-54.384 mln.
-8.85%
1 janv. 2011
540.897 mln.
-19.524 mln.
-3.48%
1 janv. 2012
577.727 mln.
+36.829 mln.
6.81%
1 janv. 2013
519.131 mln.
-58.596 mln.
-10.14%
1 janv. 2014
509.133 mln.
-9.998 mln.
-1.93%
1 janv. 2015
477.904 mln.
-31.229 mln.
-6.13%
Classement des pays selon les statistiques actuelles par années


Commentaires: