29
/fr/
fr
AIzaSyAYiBZKx7MnpbEhh9jyipgxe19OcubqV5w
April 1, 2024
123088
Ecuador
ECU
true
2
1
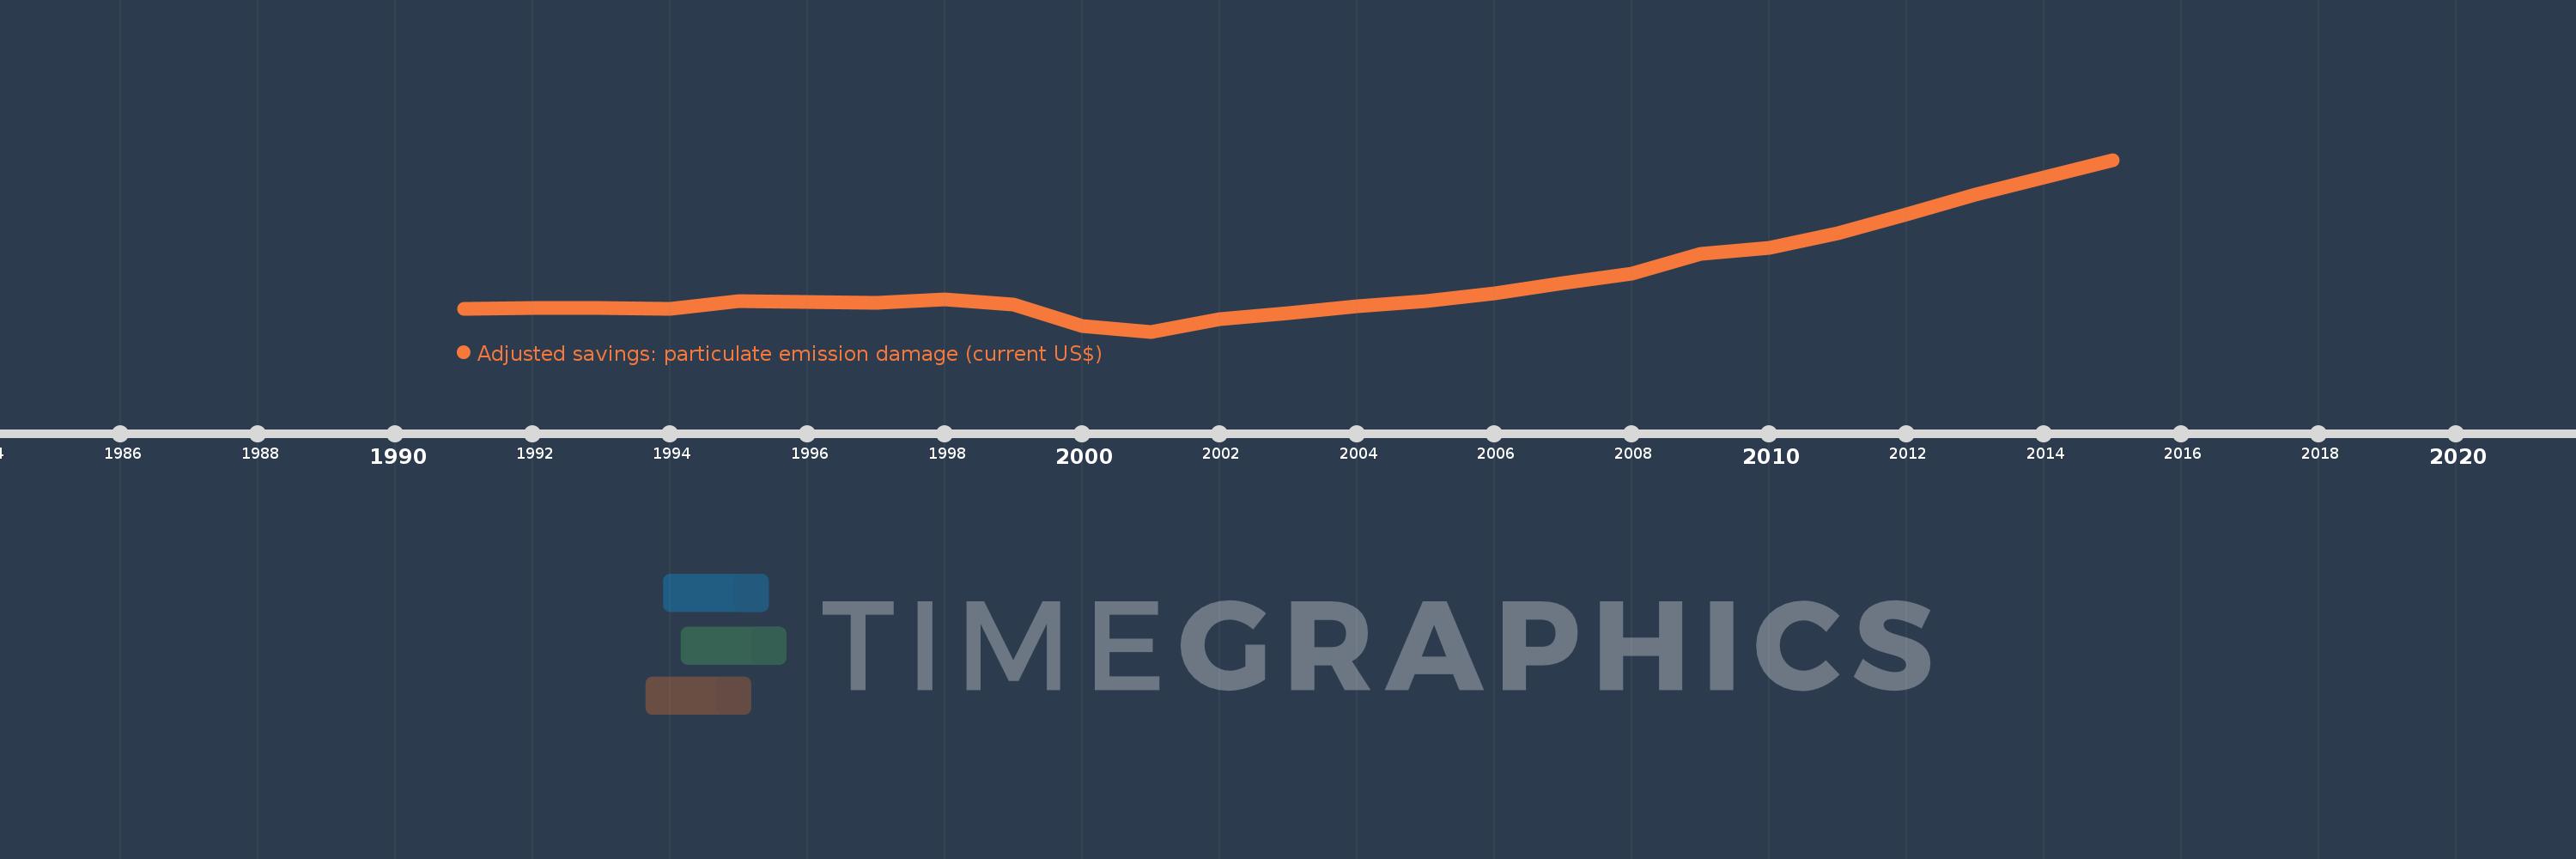
Adjusted savings: particulate emission damage (current US$)
2015,2014,2013,2012,2011,2010,2009,2008,2007,2006,2005,2004,2003,2002,2001,2000,1999,1998,1997,1996,1995,1994,1993,1992,1991
Cette statistique dans les autres pays:
AfghanistanAlbaniaAlgeriaAndorraAngolaAntigua and BarbudaArgentinaArmeniaAustraliaAustriaAzerbaijanBahamas, TheBahrainBangladeshBarbadosBelarusBelgiumBelizeBeninBhutanBoliviaBosnia and HerzegovinaBotswanaBrazilBrunei DarussalamBulgariaBurkina FasoBurundiCabo VerdeCambodiaCameroonCanadaCentral African RepublicChadChileChinaColombiaComorosCongo, Dem. Rep.Congo, Rep.Costa RicaCote d'IvoireCroatiaCubaCyprusCzech RepublicDenmarkDjiboutiDominicaDominican RepublicEcuadorEgypt, Arab Rep.El SalvadorEquatorial GuineaEritreaEstoniaEthiopiaFijiFinlandFranceGabonGambia, TheGeorgiaGermanyGhanaGreeceGrenadaGuatemalaGuineaGuinea-BissauGuyanaHaitiHondurasHong Kong SAR, ChinaHungaryIcelandIndiaIndonesiaIran, Islamic Rep.IraqIrelandIsraelItalyJamaicaJapanJordanKazakhstanKenyaKorea, Dem. People’s Rep.Korea, Rep.KuwaitKyrgyz RepublicLao PDRLatviaLebanonLesothoLiberiaLibyaLithuaniaLuxembourgMacao SAR, ChinaMacedonia, FYRMadagascarMalawiMalaysiaMaldivesMaliMaltaMauritaniaMauritiusMexicoMoldovaMonacoMongoliaMontenegroMoroccoMozambiqueMyanmarNamibiaNepalNetherlandsNew ZealandNicaraguaNigerNigeriaNorwayOmanPakistanPanamaPapua New GuineaParaguayPeruPhilippinesPolandPortugalPuerto RicoQatarRomaniaRussian FederationRwandaSan MarinoSao Tome and PrincipeSaudi ArabiaSenegalSerbiaSierra LeoneSingaporeSlovak RepublicSloveniaSolomon IslandsSomaliaSouth AfricaSpainSri LankaSt. Kitts and NevisSt. LuciaSt. Vincent and the GrenadinesSudanSurinameSwazilandSwedenSwitzerlandSyrian Arab RepublicTajikistanTanzaniaThailandTimor-LesteTogoTrinidad and TobagoTunisiaTurkeyTurkmenistanUgandaUkraineUnited Arab EmiratesUnited KingdomUnited StatesUruguayUzbekistanVanuatuVenezuela, RBVietnamWest Bank and GazaYemen, Rep.ZambiaZimbabwe La ligne de temps
Cette échelle de temps montre un graphique de 1991 année à 2015 année Ecuador. Les données jusqu'à 1990 année ne sont pas présentés. Quantité d'observations actuelles selon dates: 25.
Source (désignation):
Les indicateurs du développement mondiale
Source (organisation):
Data on health impacts from exposure to ambient PM2.5 pollution and household air pollution are from the Global Burden of Disease 2010 study. Data are provided by the Institute for Health Metrics and Evaluation at the University of Washington.
Catégories:
Economy & Growth, Environment
Dernière mise à jour
23 avr. 2017
Les indicateurs de changement de valeurs selon les années
Minimum:
16.863 mln.
1 janv. 2001
Maximum:
82.801 mln.
1 janv. 2015
Pour la date d''observation
Valeur
Changement absolu
Le changement par rapport à la valeur précédente
1 janv. 1991
25.544 mln.
+25.544 mln.
0.0%
1 janv. 1992
25.806 mln.
+261.49 milles
1.02%
1 janv. 1993
25.925 mln.
+119.572 milles
0.46%
1 janv. 1994
25.51 mln.
-415.678 milles
-1.6%
1 janv. 1995
28.406 mln.
+2.896 mln.
11.35%
1 janv. 1996
28.303 mln.
-103.3 milles
-0.36%
1 janv. 1997
27.844 mln.
-458.402 milles
-1.62%
1 janv. 1998
29.14 mln.
+1.295 mln.
4.65%
1 janv. 1999
27.348 mln.
-1.792 mln.
-6.15%
1 janv. 2000
19.158 mln.
-8.19 mln.
-29.95%
1 janv. 2001
16.863 mln.
-2.294 mln.
-11.98%
1 janv. 2002
21.561 mln.
+4.698 mln.
27.86%
1 janv. 2003
24.018 mln.
+2.457 mln.
11.4%
1 janv. 2004
26.644 mln.
+2.626 mln.
10.93%
1 janv. 2005
28.433 mln.
+1.789 mln.
6.72%
1 janv. 2006
31.674 mln.
+3.24 mln.
11.4%
1 janv. 2007
35.536 mln.
+3.863 mln.
12.2%
1 janv. 2008
39.25 mln.
+3.713 mln.
10.45%
1 janv. 2009
46.73 mln.
+7.48 mln.
19.06%
1 janv. 2010
49.084 mln.
+2.354 mln.
5.04%
1 janv. 2011
54.529 mln.
+5.445 mln.
11.09%
1 janv. 2012
61.831 mln.
+7.302 mln.
13.39%
1 janv. 2013
69.575 mln.
+7.744 mln.
12.52%
1 janv. 2014
75.934 mln.
+6.359 mln.
9.14%
1 janv. 2015
82.801 mln.
+6.867 mln.
9.04%
Classement des pays selon les statistiques actuelles par années


Commentaires: