29
/fr/
fr
AIzaSyAYiBZKx7MnpbEhh9jyipgxe19OcubqV5w
April 1, 2024
149938
Honduras
HND
true
2
1
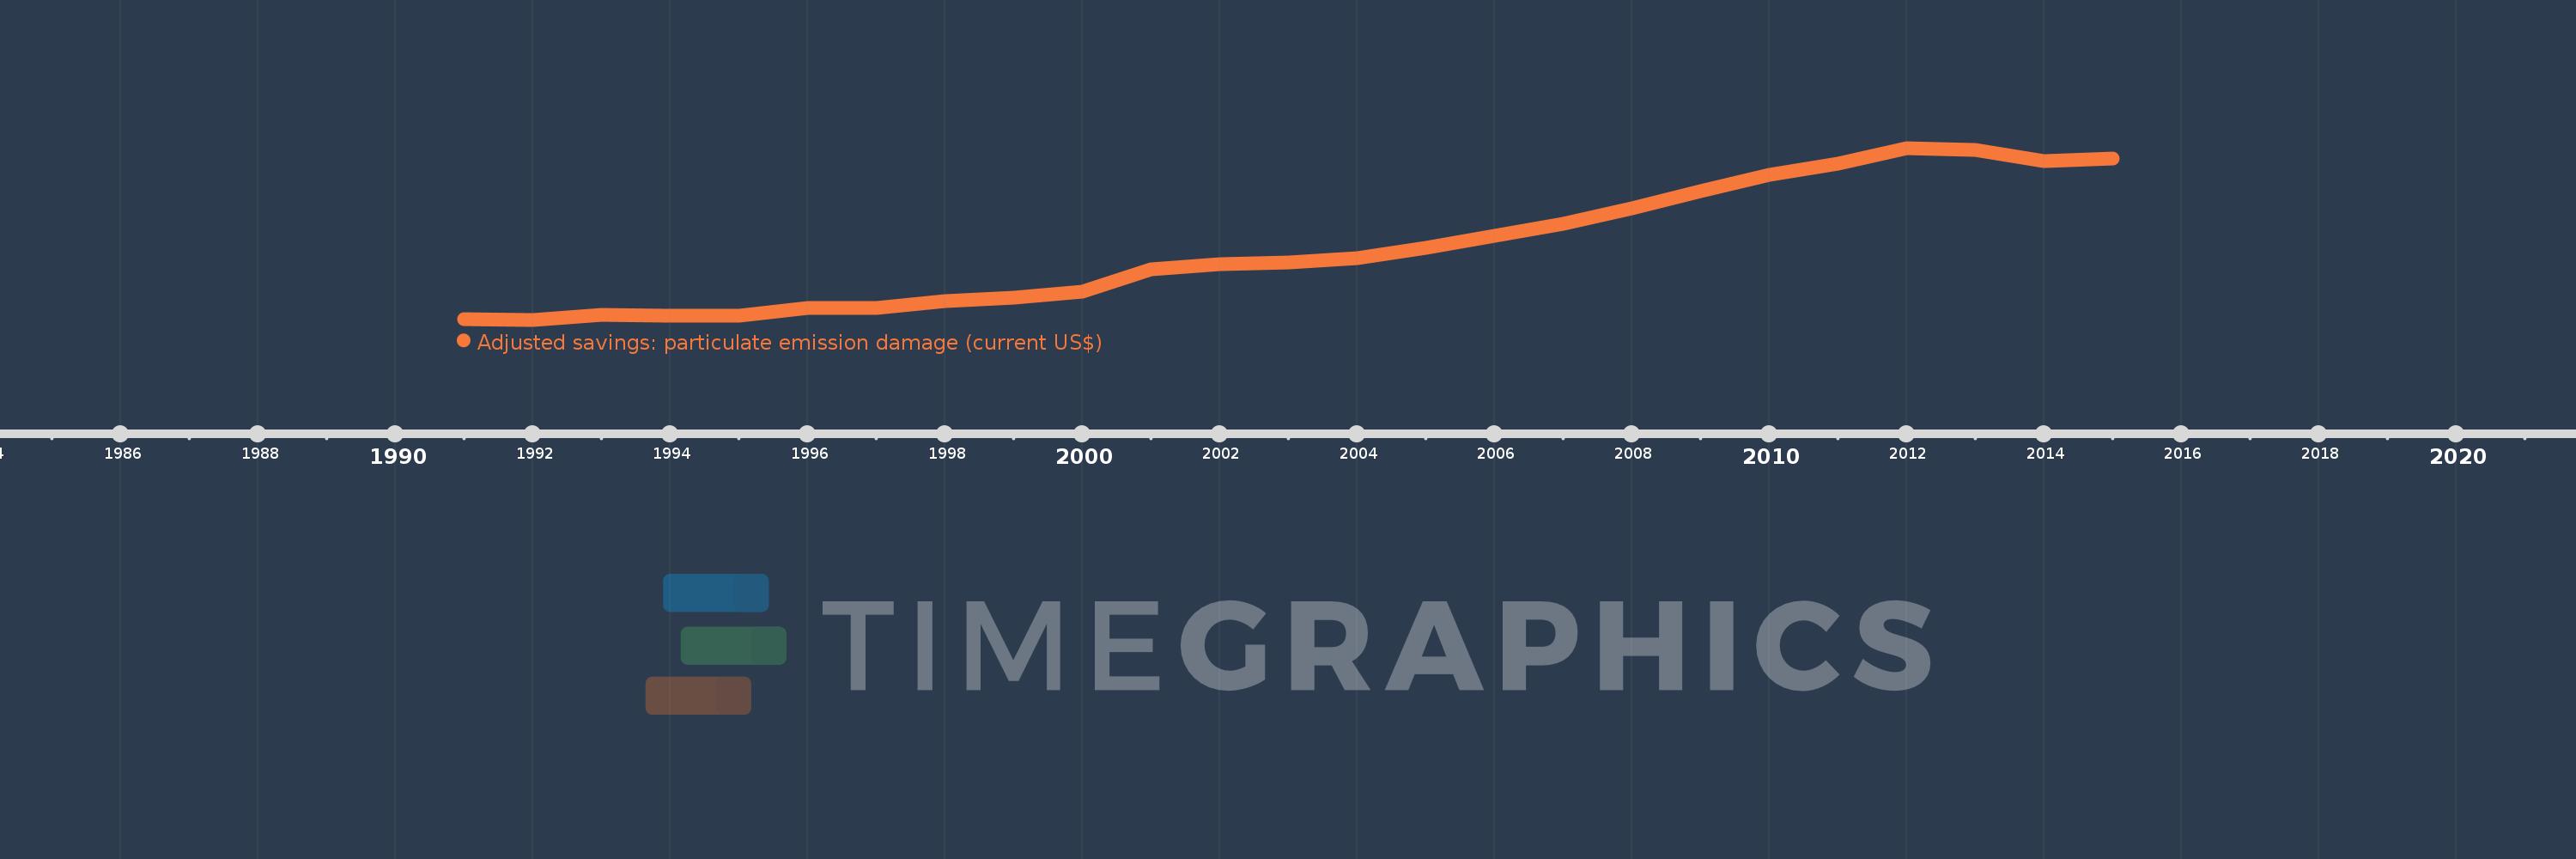
Adjusted savings: particulate emission damage (current US$)
2015,2014,2013,2012,2011,2010,2009,2008,2007,2006,2005,2004,2003,2002,2001,2000,1999,1998,1997,1996,1995,1994,1993,1992,1991
Cette statistique dans les autres pays:
AfghanistanAlbaniaAlgeriaAndorraAngolaAntigua and BarbudaArgentinaArmeniaAustraliaAustriaAzerbaijanBahamas, TheBahrainBangladeshBarbadosBelarusBelgiumBelizeBeninBhutanBoliviaBosnia and HerzegovinaBotswanaBrazilBrunei DarussalamBulgariaBurkina FasoBurundiCabo VerdeCambodiaCameroonCanadaCentral African RepublicChadChileChinaColombiaComorosCongo, Dem. Rep.Congo, Rep.Costa RicaCote d'IvoireCroatiaCubaCyprusCzech RepublicDenmarkDjiboutiDominicaDominican RepublicEcuadorEgypt, Arab Rep.El SalvadorEquatorial GuineaEritreaEstoniaEthiopiaFijiFinlandFranceGabonGambia, TheGeorgiaGermanyGhanaGreeceGrenadaGuatemalaGuineaGuinea-BissauGuyanaHaitiHondurasHong Kong SAR, ChinaHungaryIcelandIndiaIndonesiaIran, Islamic Rep.IraqIrelandIsraelItalyJamaicaJapanJordanKazakhstanKenyaKorea, Dem. People’s Rep.Korea, Rep.KuwaitKyrgyz RepublicLao PDRLatviaLebanonLesothoLiberiaLibyaLithuaniaLuxembourgMacao SAR, ChinaMacedonia, FYRMadagascarMalawiMalaysiaMaldivesMaliMaltaMauritaniaMauritiusMexicoMoldovaMonacoMongoliaMontenegroMoroccoMozambiqueMyanmarNamibiaNepalNetherlandsNew ZealandNicaraguaNigerNigeriaNorwayOmanPakistanPanamaPapua New GuineaParaguayPeruPhilippinesPolandPortugalPuerto RicoQatarRomaniaRussian FederationRwandaSan MarinoSao Tome and PrincipeSaudi ArabiaSenegalSerbiaSierra LeoneSingaporeSlovak RepublicSloveniaSolomon IslandsSomaliaSouth AfricaSpainSri LankaSt. Kitts and NevisSt. LuciaSt. Vincent and the GrenadinesSudanSurinameSwazilandSwedenSwitzerlandSyrian Arab RepublicTajikistanTanzaniaThailandTimor-LesteTogoTrinidad and TobagoTunisiaTurkeyTurkmenistanUgandaUkraineUnited Arab EmiratesUnited KingdomUnited StatesUruguayUzbekistanVanuatuVenezuela, RBVietnamWest Bank and GazaYemen, Rep.ZambiaZimbabwe La ligne de temps
Cette échelle de temps montre un graphique de 1991 année à 2015 année Honduras. Les données jusqu'à 1990 année ne sont pas présentés. Quantité d'observations actuelles selon dates: 25.
Source (désignation):
Les indicateurs du développement mondiale
Source (organisation):
Data on health impacts from exposure to ambient PM2.5 pollution and household air pollution are from the Global Burden of Disease 2010 study. Data are provided by the Institute for Health Metrics and Evaluation at the University of Washington.
Catégories:
Economy & Growth, Environment
Dernière mise à jour
23 avr. 2017
Les indicateurs de changement de valeurs selon les années
Minimum:
26.543 mln.
1 janv. 1992
Maximum:
95.451 mln.
1 janv. 2012
Pour la date d''observation
Valeur
Changement absolu
Le changement par rapport à la valeur précédente
1 janv. 1991
26.797 mln.
+26.797 mln.
0.0%
1 janv. 1992
26.543 mln.
-253.795 milles
-0.95%
1 janv. 1993
28.511 mln.
+1.968 mln.
7.41%
1 janv. 1994
28.003 mln.
-508.15 milles
-1.78%
1 janv. 1995
28.294 mln.
+291.247 milles
1.04%
1 janv. 1996
31.372 mln.
+3.078 mln.
10.88%
1 janv. 1997
31.103 mln.
-269.934 milles
-0.86%
1 janv. 1998
34.061 mln.
+2.958 mln.
9.51%
1 janv. 1999
35.34 mln.
+1.279 mln.
3.76%
1 janv. 2000
37.778 mln.
+2.438 mln.
6.9%
1 janv. 2001
46.797 mln.
+9.018 mln.
23.87%
1 janv. 2002
49.003 mln.
+2.206 mln.
4.71%
1 janv. 2003
49.583 mln.
+580.467 milles
1.18%
1 janv. 2004
51.41 mln.
+1.826 mln.
3.68%
1 janv. 2005
55.277 mln.
+3.867 mln.
7.52%
1 janv. 2006
60.248 mln.
+4.971 mln.
8.99%
1 janv. 2007
65.156 mln.
+4.908 mln.
8.15%
1 janv. 2008
71.341 mln.
+6.185 mln.
9.49%
1 janv. 2009
78.223 mln.
+6.882 mln.
9.65%
1 janv. 2010
84.707 mln.
+6.484 mln.
8.29%
1 janv. 2011
89.074 mln.
+4.367 mln.
5.16%
1 janv. 2012
95.451 mln.
+6.377 mln.
7.16%
1 janv. 2013
94.588 mln.
-862.63 milles
-0.9%
1 janv. 2014
90.235 mln.
-4.353 mln.
-4.6%
1 janv. 2015
91.266 mln.
+1.031 mln.
1.14%
Classement des pays selon les statistiques actuelles par années


Commentaires: