29
/fr/
fr
AIzaSyAYiBZKx7MnpbEhh9jyipgxe19OcubqV5w
April 1, 2024
248284
Sri Lanka
LKA
true
2
1
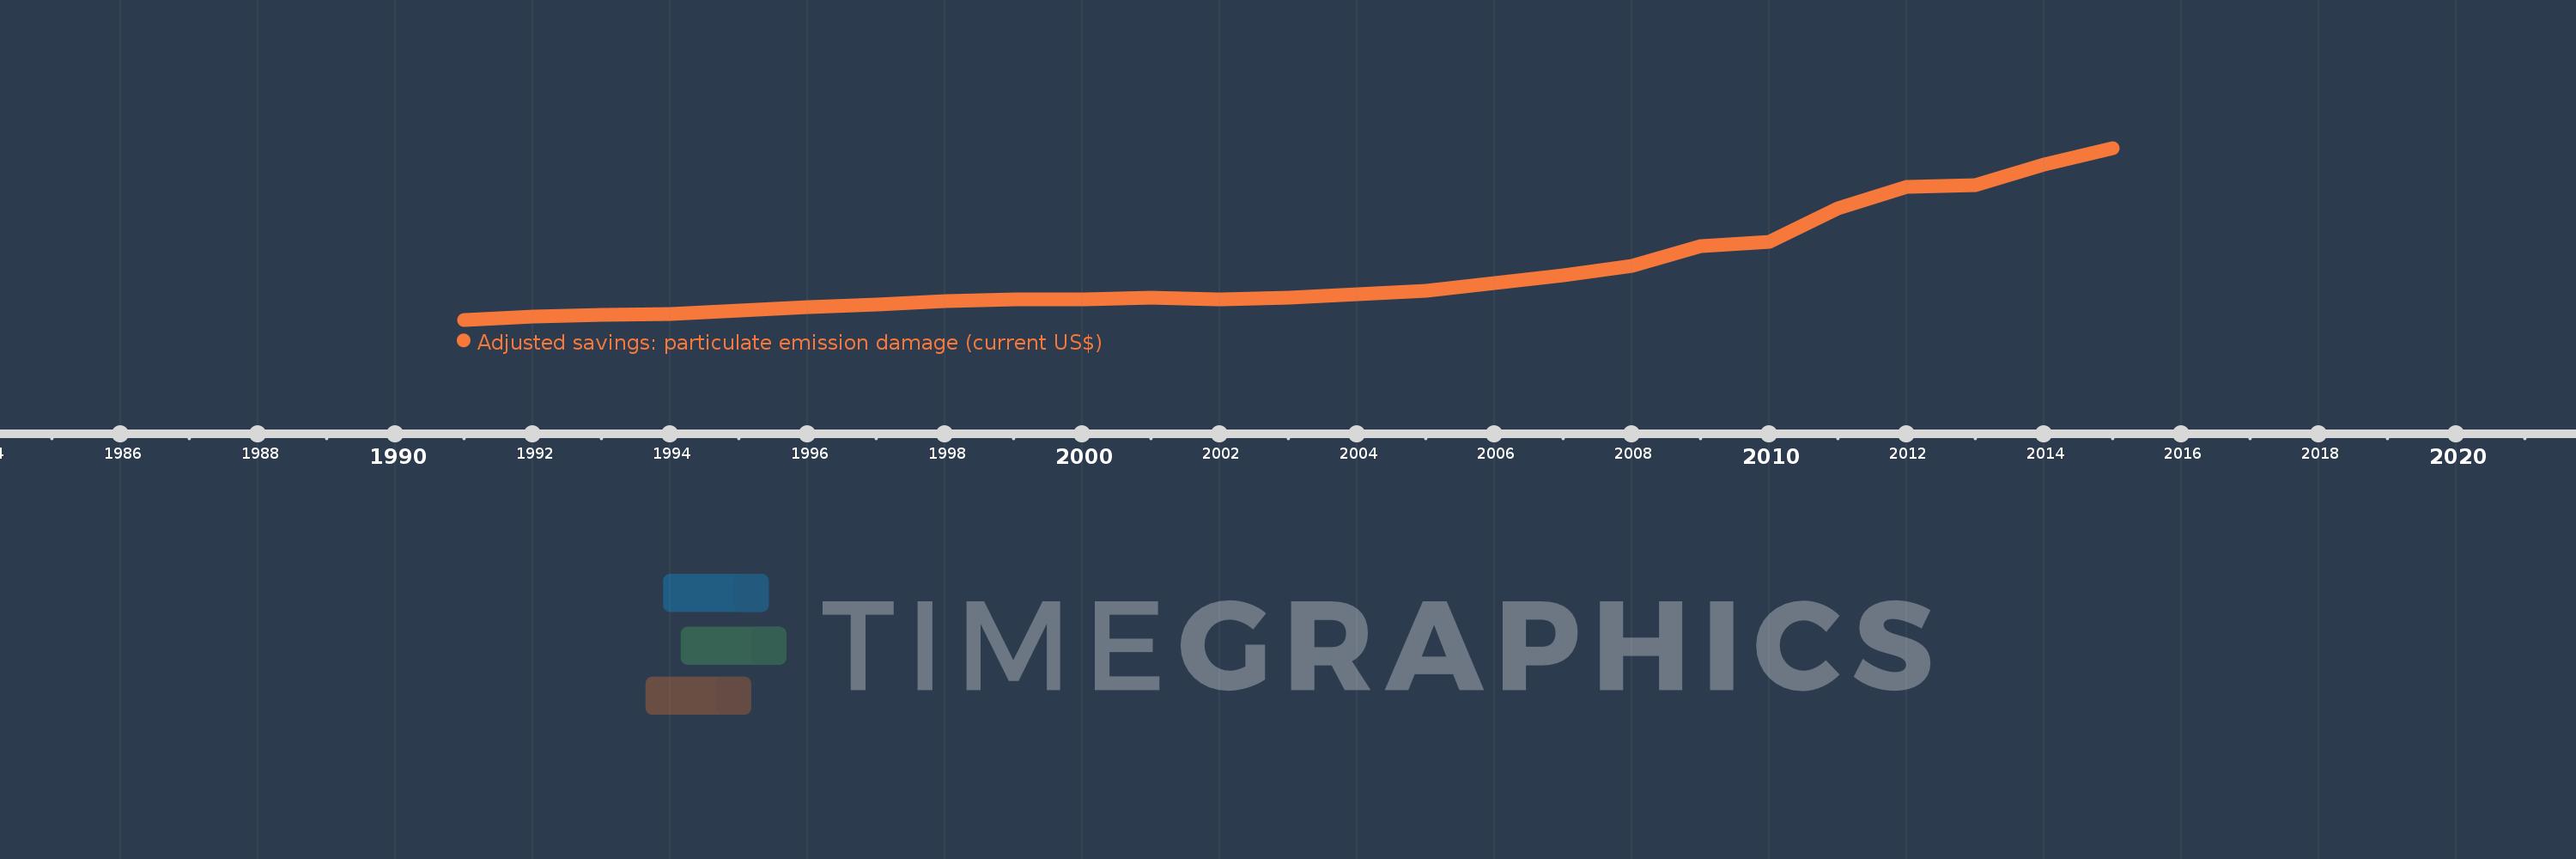
Adjusted savings: particulate emission damage (current US$)
2015,2014,2013,2012,2011,2010,2009,2008,2007,2006,2005,2004,2003,2002,2001,2000,1999,1998,1997,1996,1995,1994,1993,1992,1991
Cette statistique dans les autres pays:
AfghanistanAlbaniaAlgeriaAndorraAngolaAntigua and BarbudaArgentinaArmeniaAustraliaAustriaAzerbaijanBahamas, TheBahrainBangladeshBarbadosBelarusBelgiumBelizeBeninBhutanBoliviaBosnia and HerzegovinaBotswanaBrazilBrunei DarussalamBulgariaBurkina FasoBurundiCabo VerdeCambodiaCameroonCanadaCentral African RepublicChadChileChinaColombiaComorosCongo, Dem. Rep.Congo, Rep.Costa RicaCote d'IvoireCroatiaCubaCyprusCzech RepublicDenmarkDjiboutiDominicaDominican RepublicEcuadorEgypt, Arab Rep.El SalvadorEquatorial GuineaEritreaEstoniaEthiopiaFijiFinlandFranceGabonGambia, TheGeorgiaGermanyGhanaGreeceGrenadaGuatemalaGuineaGuinea-BissauGuyanaHaitiHondurasHong Kong SAR, ChinaHungaryIcelandIndiaIndonesiaIran, Islamic Rep.IraqIrelandIsraelItalyJamaicaJapanJordanKazakhstanKenyaKorea, Dem. People’s Rep.Korea, Rep.KuwaitKyrgyz RepublicLao PDRLatviaLebanonLesothoLiberiaLibyaLithuaniaLuxembourgMacao SAR, ChinaMacedonia, FYRMadagascarMalawiMalaysiaMaldivesMaliMaltaMauritaniaMauritiusMexicoMoldovaMonacoMongoliaMontenegroMoroccoMozambiqueMyanmarNamibiaNepalNetherlandsNew ZealandNicaraguaNigerNigeriaNorwayOmanPakistanPanamaPapua New GuineaParaguayPeruPhilippinesPolandPortugalPuerto RicoQatarRomaniaRussian FederationRwandaSan MarinoSao Tome and PrincipeSaudi ArabiaSenegalSerbiaSierra LeoneSingaporeSlovak RepublicSloveniaSolomon IslandsSomaliaSouth AfricaSpainSri LankaSt. Kitts and NevisSt. LuciaSt. Vincent and the GrenadinesSudanSurinameSwazilandSwedenSwitzerlandSyrian Arab RepublicTajikistanTanzaniaThailandTimor-LesteTogoTrinidad and TobagoTunisiaTurkeyTurkmenistanUgandaUkraineUnited Arab EmiratesUnited KingdomUnited StatesUruguayUzbekistanVanuatuVenezuela, RBVietnamWest Bank and GazaYemen, Rep.ZambiaZimbabwe La ligne de temps
Cette échelle de temps montre un graphique de 1991 année à 2015 année Sri Lanka. Les données jusqu'à 1990 année ne sont pas présentés. Quantité d'observations actuelles selon dates: 25.
Source (désignation):
Les indicateurs du développement mondiale
Source (organisation):
Data on health impacts from exposure to ambient PM2.5 pollution and household air pollution are from the Global Burden of Disease 2010 study. Data are provided by the Institute for Health Metrics and Evaluation at the University of Washington.
Catégories:
Economy & Growth, Environment
Dernière mise à jour
23 avr. 2017
Les indicateurs de changement de valeurs selon les années
Minimum:
89.161 mln.
1 janv. 1991
Maximum:
691.417 mln.
1 janv. 2015
Pour la date d''observation
Valeur
Changement absolu
Le changement par rapport à la valeur précédente
1 janv. 1991
89.161 mln.
+89.161 mln.
0.0%
1 janv. 1992
100.764 mln.
+11.604 mln.
13.01%
1 janv. 1993
106.854 mln.
+6.089 mln.
6.04%
1 janv. 1994
109.945 mln.
+3.091 mln.
2.89%
1 janv. 1995
121.729 mln.
+11.784 mln.
10.72%
1 janv. 1996
133.787 mln.
+12.059 mln.
9.91%
1 janv. 1997
143.26 mln.
+9.472 mln.
7.08%
1 janv. 1998
154.934 mln.
+11.675 mln.
8.15%
1 janv. 1999
161.786 mln.
+6.852 mln.
4.42%
1 janv. 2000
161.738 mln.
-48.482 milles
-0.03%
1 janv. 2001
166.38 mln.
+4.642 mln.
2.87%
1 janv. 2002
160.335 mln.
-6.045 mln.
-3.63%
1 janv. 2003
166.86 mln.
+6.525 mln.
4.07%
1 janv. 2004
179.318 mln.
+12.458 mln.
7.47%
1 janv. 2005
191.593 mln.
+12.275 mln.
6.85%
1 janv. 2006
218.131 mln.
+26.537 mln.
13.85%
1 janv. 2007
244.698 mln.
+26.567 mln.
12.18%
1 janv. 2008
277.408 mln.
+32.71 mln.
13.37%
1 janv. 2009
346.626 mln.
+69.217 mln.
24.95%
1 janv. 2010
362.483 mln.
+15.857 mln.
4.57%
1 janv. 2011
480.493 mln.
+118.01 mln.
32.56%
1 janv. 2012
554.564 mln.
+74.071 mln.
15.42%
1 janv. 2013
560.763 mln.
+6.198 mln.
1.12%
1 janv. 2014
634.051 mln.
+73.288 mln.
13.07%
1 janv. 2015
691.417 mln.
+57.366 mln.
9.05%
Classement des pays selon les statistiques actuelles par années


Commentaires: