29
/fr/
fr
AIzaSyAYiBZKx7MnpbEhh9jyipgxe19OcubqV5w
April 1, 2024
139956
Ghana
GHA
true
2
1
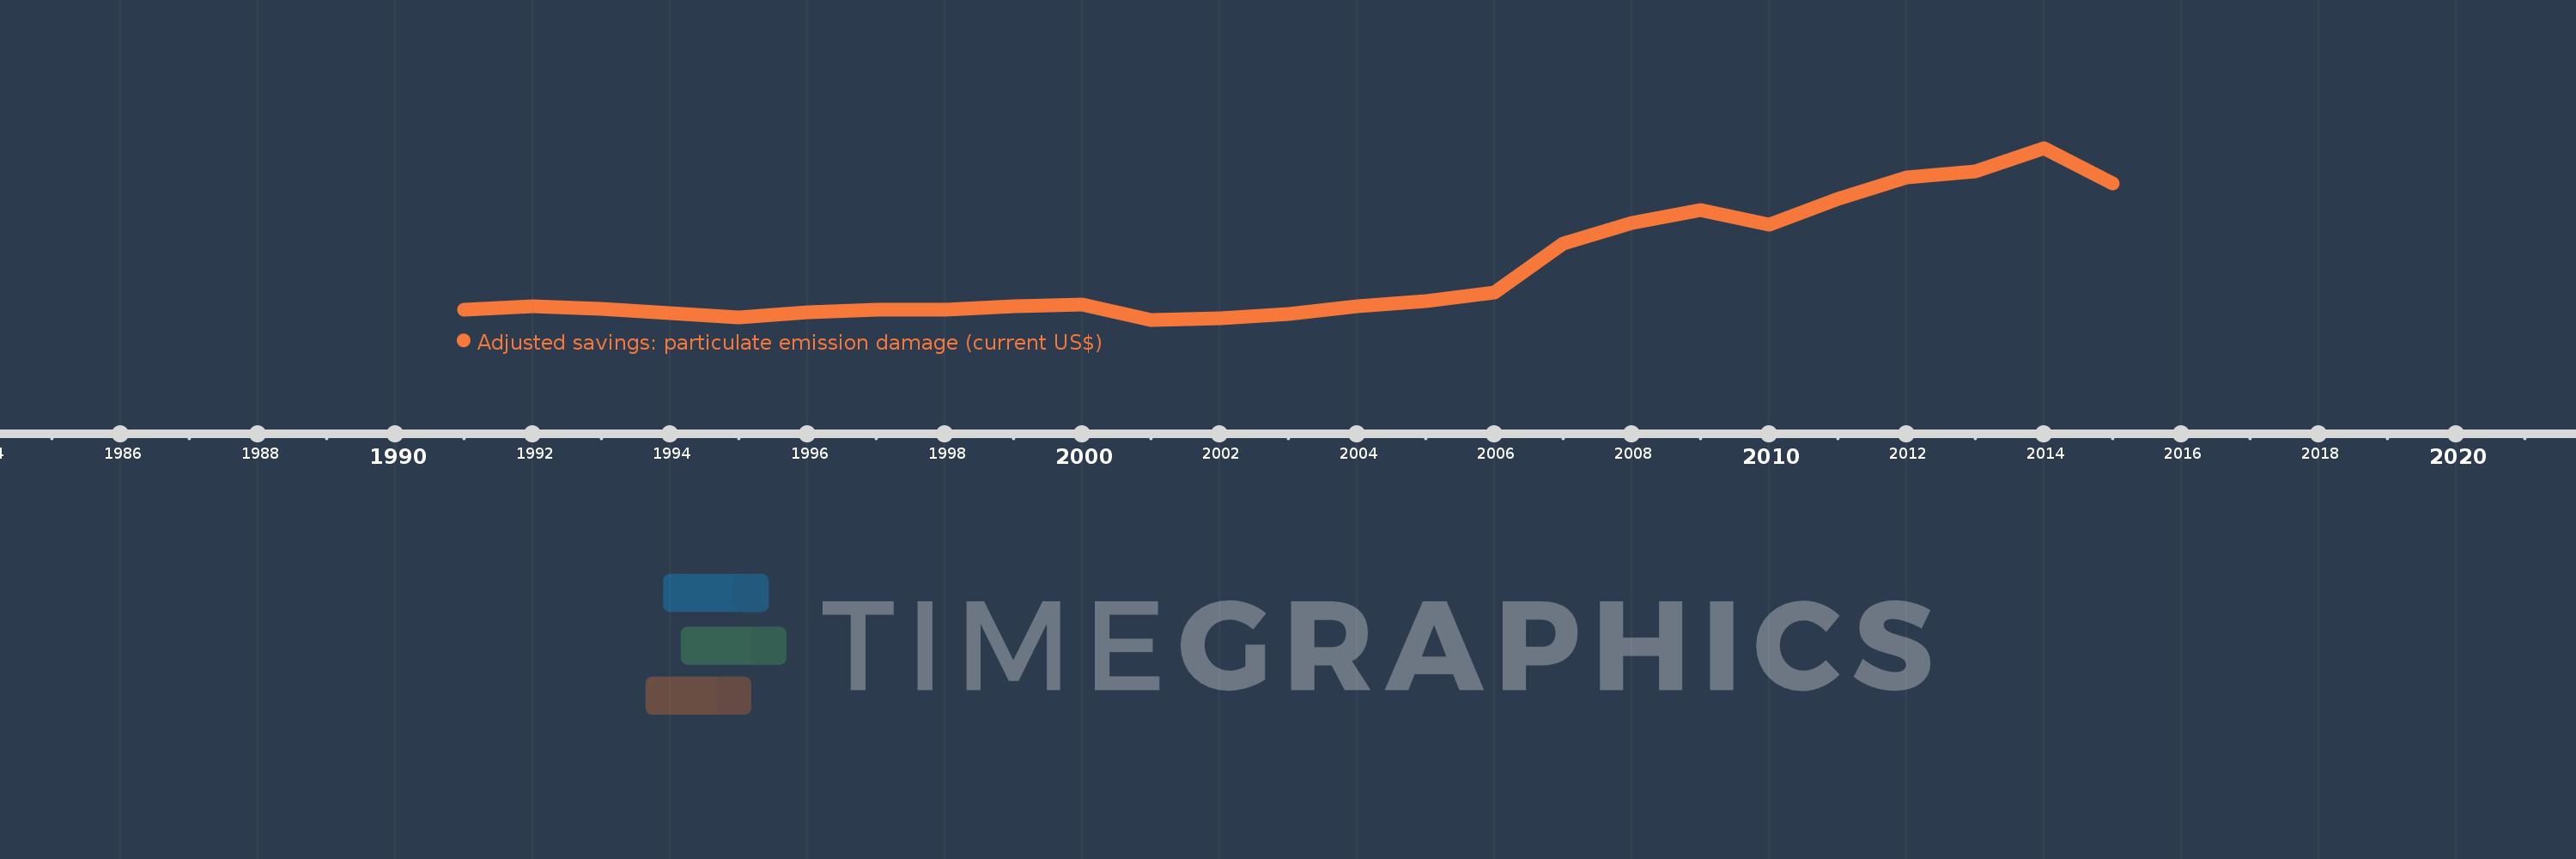
Adjusted savings: particulate emission damage (current US$)
2015,2014,2013,2012,2011,2010,2009,2008,2007,2006,2005,2004,2003,2002,2001,2000,1999,1998,1997,1996,1995,1994,1993,1992,1991
Cette statistique dans les autres pays:
AfghanistanAlbaniaAlgeriaAndorraAngolaAntigua and BarbudaArgentinaArmeniaAustraliaAustriaAzerbaijanBahamas, TheBahrainBangladeshBarbadosBelarusBelgiumBelizeBeninBhutanBoliviaBosnia and HerzegovinaBotswanaBrazilBrunei DarussalamBulgariaBurkina FasoBurundiCabo VerdeCambodiaCameroonCanadaCentral African RepublicChadChileChinaColombiaComorosCongo, Dem. Rep.Congo, Rep.Costa RicaCote d'IvoireCroatiaCubaCyprusCzech RepublicDenmarkDjiboutiDominicaDominican RepublicEcuadorEgypt, Arab Rep.El SalvadorEquatorial GuineaEritreaEstoniaEthiopiaFijiFinlandFranceGabonGambia, TheGeorgiaGermanyGhanaGreeceGrenadaGuatemalaGuineaGuinea-BissauGuyanaHaitiHondurasHong Kong SAR, ChinaHungaryIcelandIndiaIndonesiaIran, Islamic Rep.IraqIrelandIsraelItalyJamaicaJapanJordanKazakhstanKenyaKorea, Dem. People’s Rep.Korea, Rep.KuwaitKyrgyz RepublicLao PDRLatviaLebanonLesothoLiberiaLibyaLithuaniaLuxembourgMacao SAR, ChinaMacedonia, FYRMadagascarMalawiMalaysiaMaldivesMaliMaltaMauritaniaMauritiusMexicoMoldovaMonacoMongoliaMontenegroMoroccoMozambiqueMyanmarNamibiaNepalNetherlandsNew ZealandNicaraguaNigerNigeriaNorwayOmanPakistanPanamaPapua New GuineaParaguayPeruPhilippinesPolandPortugalPuerto RicoQatarRomaniaRussian FederationRwandaSan MarinoSao Tome and PrincipeSaudi ArabiaSenegalSerbiaSierra LeoneSingaporeSlovak RepublicSloveniaSolomon IslandsSomaliaSouth AfricaSpainSri LankaSt. Kitts and NevisSt. LuciaSt. Vincent and the GrenadinesSudanSurinameSwazilandSwedenSwitzerlandSyrian Arab RepublicTajikistanTanzaniaThailandTimor-LesteTogoTrinidad and TobagoTunisiaTurkeyTurkmenistanUgandaUkraineUnited Arab EmiratesUnited KingdomUnited StatesUruguayUzbekistanVanuatuVenezuela, RBVietnamWest Bank and GazaYemen, Rep.ZambiaZimbabwe La ligne de temps
Cette échelle de temps montre un graphique de 1991 année à 2015 année Ghana. Les données jusqu'à 1990 année ne sont pas présentés. Quantité d'observations actuelles selon dates: 25.
Source (désignation):
Les indicateurs du développement mondiale
Source (organisation):
Data on health impacts from exposure to ambient PM2.5 pollution and household air pollution are from the Global Burden of Disease 2010 study. Data are provided by the Institute for Health Metrics and Evaluation at the University of Washington.
Catégories:
Economy & Growth, Environment
Dernière mise à jour
23 avr. 2017
Les indicateurs de changement de valeurs selon les années
Minimum:
45.019 mln.
1 janv. 2001
Maximum:
302.989 mln.
1 janv. 2014
Pour la date d''observation
Valeur
Changement absolu
Le changement par rapport à la valeur précédente
1 janv. 1991
60.674 mln.
+60.674 mln.
0.0%
1 janv. 1992
65.643 mln.
+4.968 mln.
8.19%
1 janv. 1993
61.669 mln.
-3.974 mln.
-6.05%
1 janv. 1994
55.56 mln.
-6.109 mln.
-9.91%
1 janv. 1995
49.123 mln.
-6.437 mln.
-11.59%
1 janv. 1996
55.995 mln.
+6.872 mln.
13.99%
1 janv. 1997
60.074 mln.
+4.079 mln.
7.28%
1 janv. 1998
59.986 mln.
-87.891 milles
-0.15%
1 janv. 1999
64.643 mln.
+4.657 mln.
7.76%
1 janv. 2000
67.669 mln.
+3.026 mln.
4.68%
1 janv. 2001
45.019 mln.
-22.65 mln.
-33.47%
1 janv. 2002
46.899 mln.
+1.88 mln.
4.18%
1 janv. 2003
53.526 mln.
+6.627 mln.
14.13%
1 janv. 2004
64.73 mln.
+11.204 mln.
20.93%
1 janv. 2005
73.556 mln.
+8.826 mln.
13.63%
1 janv. 2006
86.211 mln.
+12.655 mln.
17.2%
1 janv. 2007
159.41 mln.
+73.199 mln.
84.91%
1 janv. 2008
190.076 mln.
+30.667 mln.
19.24%
1 janv. 2009
209.18 mln.
+19.104 mln.
10.05%
1 janv. 2010
187.552 mln.
-21.628 mln.
-10.34%
1 janv. 2011
226.062 mln.
+38.509 mln.
20.53%
1 janv. 2012
259.155 mln.
+33.094 mln.
14.64%
1 janv. 2013
268.415 mln.
+9.26 mln.
3.57%
1 janv. 2014
302.989 mln.
+34.574 mln.
12.88%
1 janv. 2015
249.618 mln.
-53.371 mln.
-17.61%
Classement des pays selon les statistiques actuelles par années


Commentaires: