29
/es/
es
AIzaSyAYiBZKx7MnpbEhh9jyipgxe19OcubqV5w
April 1, 2024
99910
Cameroon
CMR
true
2
1
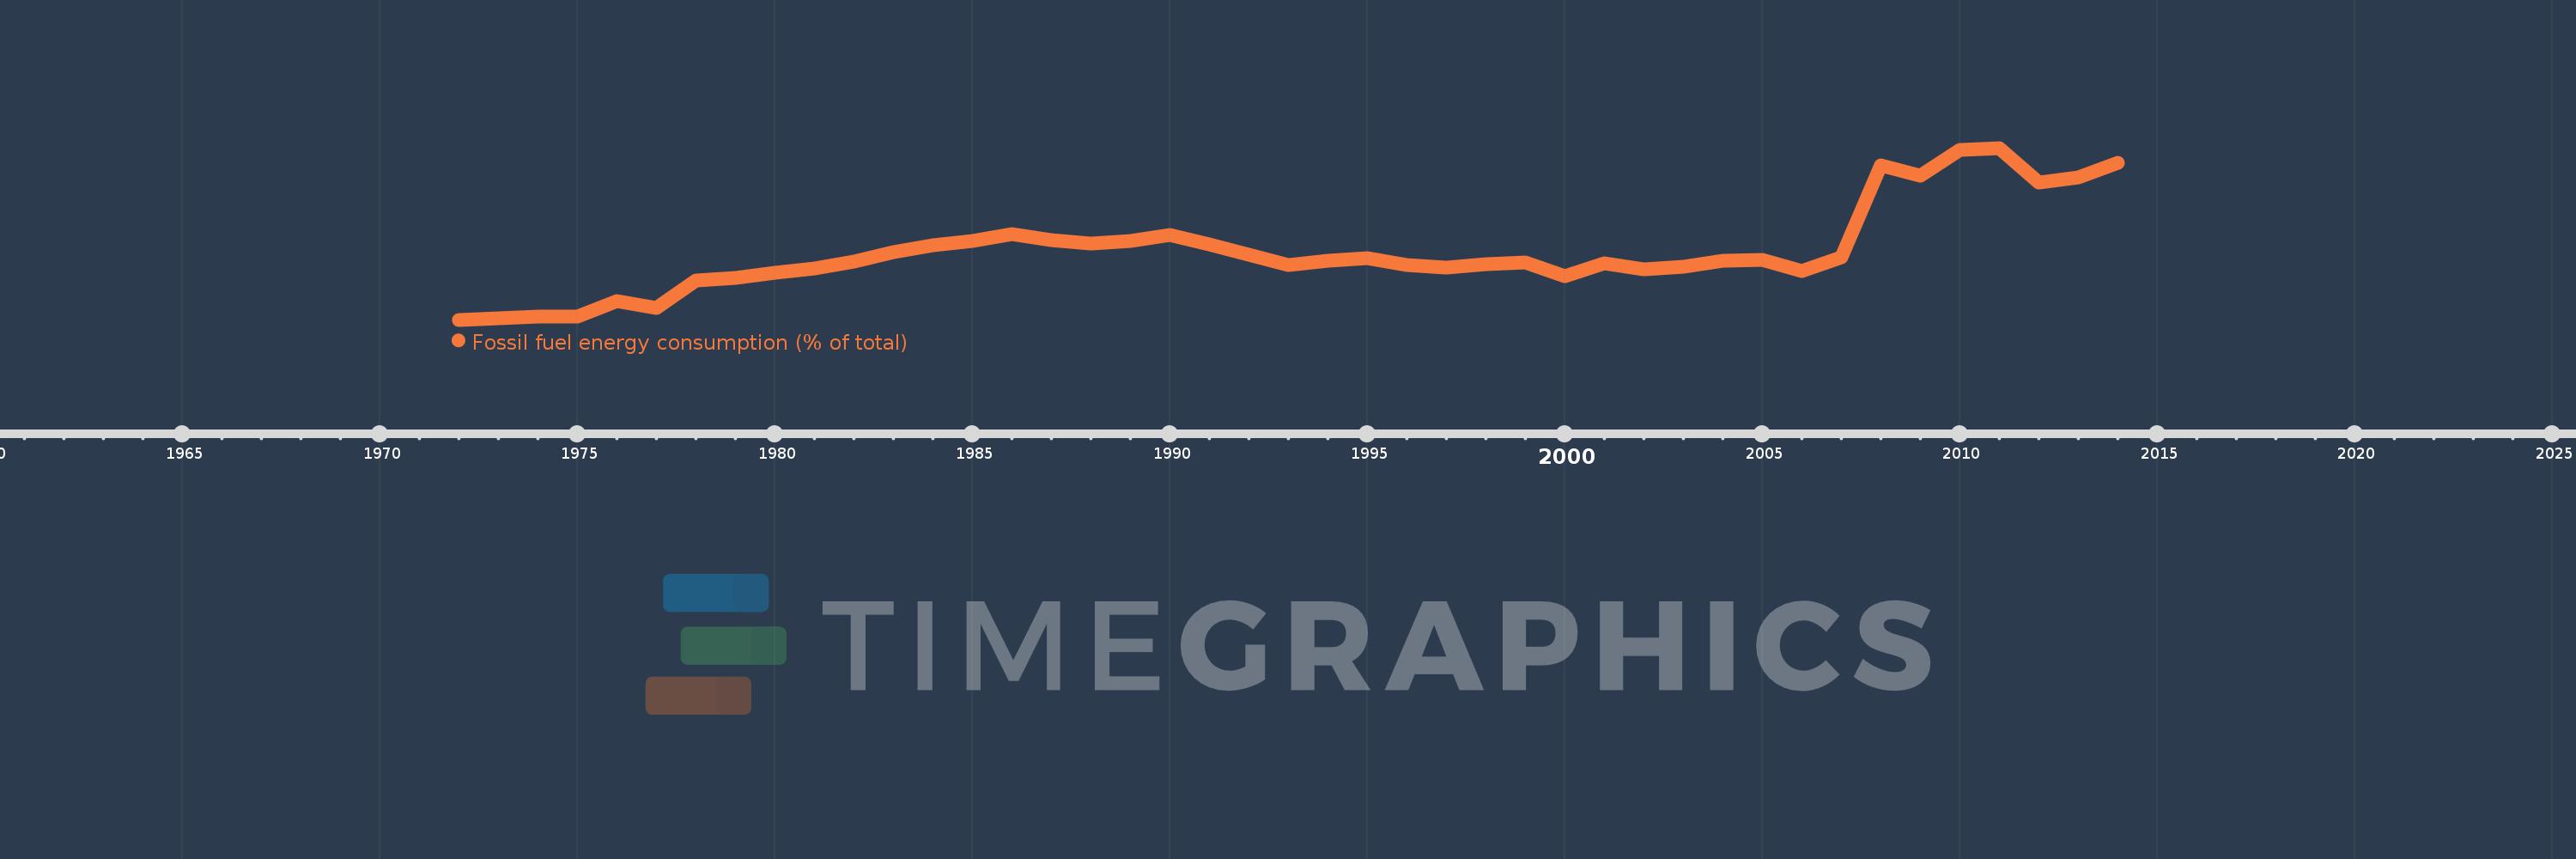
Fossil fuel energy consumption (% of total)
2014,2013,2012,2011,2010,2009,2008,2007,2006,2005,2004,2003,2002,2001,2000,1999,1998,1997,1996,1995,1994,1993,1992,1991,1990,1989,1988,1987,1986,1985,1984,1983,1982,1981,1980,1979,1978,1977,1976,1975,1974,1973,1972
Estas estadísticas en otros países:
AlbaniaAlgeriaAngolaAntigua and BarbudaArab WorldArgentinaArmeniaAustraliaAustriaAzerbaijanBahamas, TheBahrainBangladeshBarbadosBelarusBelgiumBelizeBeninBhutanBoliviaBosnia and HerzegovinaBotswanaBrazilBrunei DarussalamBulgariaCabo VerdeCambodiaCameroonCanadaCaribbean small statesCentral Europe and the BalticsChileChinaColombiaComorosCongo, Dem. Rep.Congo, Rep.Costa RicaCote d'IvoireCroatiaCubaCuracaoCyprusCzech RepublicDenmarkDjiboutiDominicaDominican RepublicEarly-demographic dividendEast Asia & PacificEast Asia & Pacific (excluding high income)East Asia & Pacific (IDA & IBRD countries)EcuadorEgypt, Arab Rep.El SalvadorEquatorial GuineaEritreaEstoniaEthiopiaEuro areaEurope & Central AsiaEurope & Central Asia (excluding high income)Europe & Central Asia (IDA & IBRD countries)European UnionFijiFinlandFragile and conflict affected situationsFranceGabonGambia, TheGeorgiaGermanyGhanaGibraltarGreeceGrenadaGuatemalaGuinea-BissauGuyanaHaitiHeavily indebted poor countries (HIPC)High incomeHondurasHong Kong SAR, ChinaHungaryIBRD onlyIcelandIDA & IBRD totalIDA blendIDA onlyIDA totalIndiaIndonesiaIran, Islamic Rep.IraqIrelandIsraelItalyJamaicaJapanJordanKazakhstanKenyaKiribatiKorea, Dem. People’s Rep.Korea, Rep.KosovoKuwaitKyrgyz RepublicLate-demographic dividendLatin America & Caribbean Latin America & Caribbean (excluding high income)Latin America & the Caribbean (IDA & IBRD countries)LatviaLeast developed countries: UN classificationLebanonLesothoLibyaLithuaniaLow & middle incomeLow incomeLower middle incomeLuxembourgMacedonia, FYRMalaysiaMaldivesMaltaMarshall IslandsMauritiusMexicoMiddle East & North AfricaMiddle East & North Africa (excluding high income)Middle East & North Africa (IDA & IBRD countries)Middle incomeMoldovaMongoliaMontenegroMoroccoMozambiqueMyanmarNamibiaNepalNetherlandsNew ZealandNicaraguaNigerNigeriaNorth AmericaNorwayOECD membersOmanOther small statesPacific island small statesPakistanPalauPanamaParaguayPeruPhilippinesPolandPortugalPost-demographic dividendPre-demographic dividendQatarRomaniaRussian FederationSamoaSao Tome and PrincipeSaudi ArabiaSenegalSerbiaSeychellesSingaporeSlovak RepublicSloveniaSmall statesSolomon IslandsSouth AfricaSouth AsiaSouth Asia (IDA & IBRD)South SudanSpainSri LankaSt. Kitts and NevisSt. LuciaSt. Vincent and the GrenadinesSub-Saharan Africa Sub-Saharan Africa (excluding high income)Sub-Saharan Africa (IDA & IBRD countries)SudanSurinameSwazilandSwedenSwitzerlandSyrian Arab RepublicTajikistanTanzaniaThailandTimor-LesteTogoTongaTrinidad and TobagoTunisiaTurkeyUkraineUnited Arab EmiratesUnited KingdomUnited StatesUpper middle incomeUruguayUzbekistanVanuatuVenezuela, RBVietnamWorldYemen, Rep.ZambiaZimbabwe línea de tiempo (timeline):
En esta escala de tiempo se presenta un gráfico de 1972 y 2014 de Cameroon. Los datos de 1971 están ausentes. El número de observaciones reales por fecha: 43.
Fuente (nombre):
Indicadores del desarrollo mundial
Fuente (organización):
IEA Statistics © OECD/IEA 2014 (http://www.iea.org/stats/index.asp), subject to https://www.iea.org/t&c/termsandconditions/
Categorías:
Energy & Mining
Se ha actualizado:
23 abr 2017 año
Los indicadores de los cambios de valor en los últimos años
Mínimo:
9.007
1 ene 1972 año
Máximo:
31.164
1 ene 2011 año
A la fecha de observación
Valor
Cambio absoluto
El cambio con respecto al valor anterior
1 ene 1972 año
9.007
+9.007
0.0%
1 ene 1973 año
9.219
+0.212
2.35%
1 ene 1974 año
9.373
+0.153
1.66%
1 ene 1975 año
9.472
+0.1
1.06%
1 ene 1976 año
11.391
+1.919
20.26%
1 ene 1977 año
10.471
-0.92
-8.07%
1 ene 1978 año
14.068
+3.597
34.35%
1 ene 1979 año
14.356
+0.288
2.05%
1 ene 1980 año
15.039
+0.683
4.76%
1 ene 1981 año
15.572
+0.533
3.54%
1 ene 1982 año
16.528
+0.956
6.14%
1 ene 1983 año
17.771
+1.243
7.52%
1 ene 1984 año
18.609
+0.839
4.72%
1 ene 1985 año
19.177
+0.568
3.05%
1 ene 1986 año
20.014
+0.837
4.37%
1 ene 1987 año
19.272
-0.742
-3.71%
1 ene 1988 año
18.822
-0.45
-2.34%
1 ene 1989 año
19.17
+0.347
1.84%
1 ene 1990 año
19.923
+0.753
3.93%
1 ene 1991 año
18.711
-1.212
-6.08%
1 ene 1992 año
17.389
-1.322
-7.07%
1 ene 1993 año
16.111
-1.278
-7.35%
1 ene 1994 año
16.654
+0.544
3.37%
1 ene 1995 año
16.905
+0.25
1.5%
1 ene 1996 año
16.074
-0.83
-4.91%
1 ene 1997 año
15.69
-0.385
-2.39%
1 ene 1998 año
16.154
+0.465
2.96%
1 ene 1999 año
16.36
+0.206
1.27%
1 ene 2000 año
14.652
-1.708
-10.44%
1 ene 2001 año
16.307
+1.655
11.3%
1 ene 2002 año
15.523
-0.785
-4.81%
1 ene 2003 año
15.81
+0.287
1.85%
1 ene 2004 año
16.644
+0.834
5.27%
1 ene 2005 año
16.684
+0.04
0.24%
1 ene 2006 año
15.327
-1.357
-8.13%
1 ene 2007 año
17.042
+1.715
11.19%
1 ene 2008 año
28.885
+11.843
69.49%
1 ene 2009 año
27.622
-1.263
-4.37%
1 ene 2010 año
30.893
+3.271
11.84%
1 ene 2011 año
31.164
+0.271
0.88%
1 ene 2012 año
26.729
-4.435
-14.23%
1 ene 2013 año
27.352
+0.623
2.33%
1 ene 2014 año
29.279
+1.927
7.05%
Ranking de los países por los datos estadísticos actuales


Comentarios: