29
/es/
es
AIzaSyAYiBZKx7MnpbEhh9jyipgxe19OcubqV5w
April 1, 2024
277661
Uruguay
URY
true
2
1
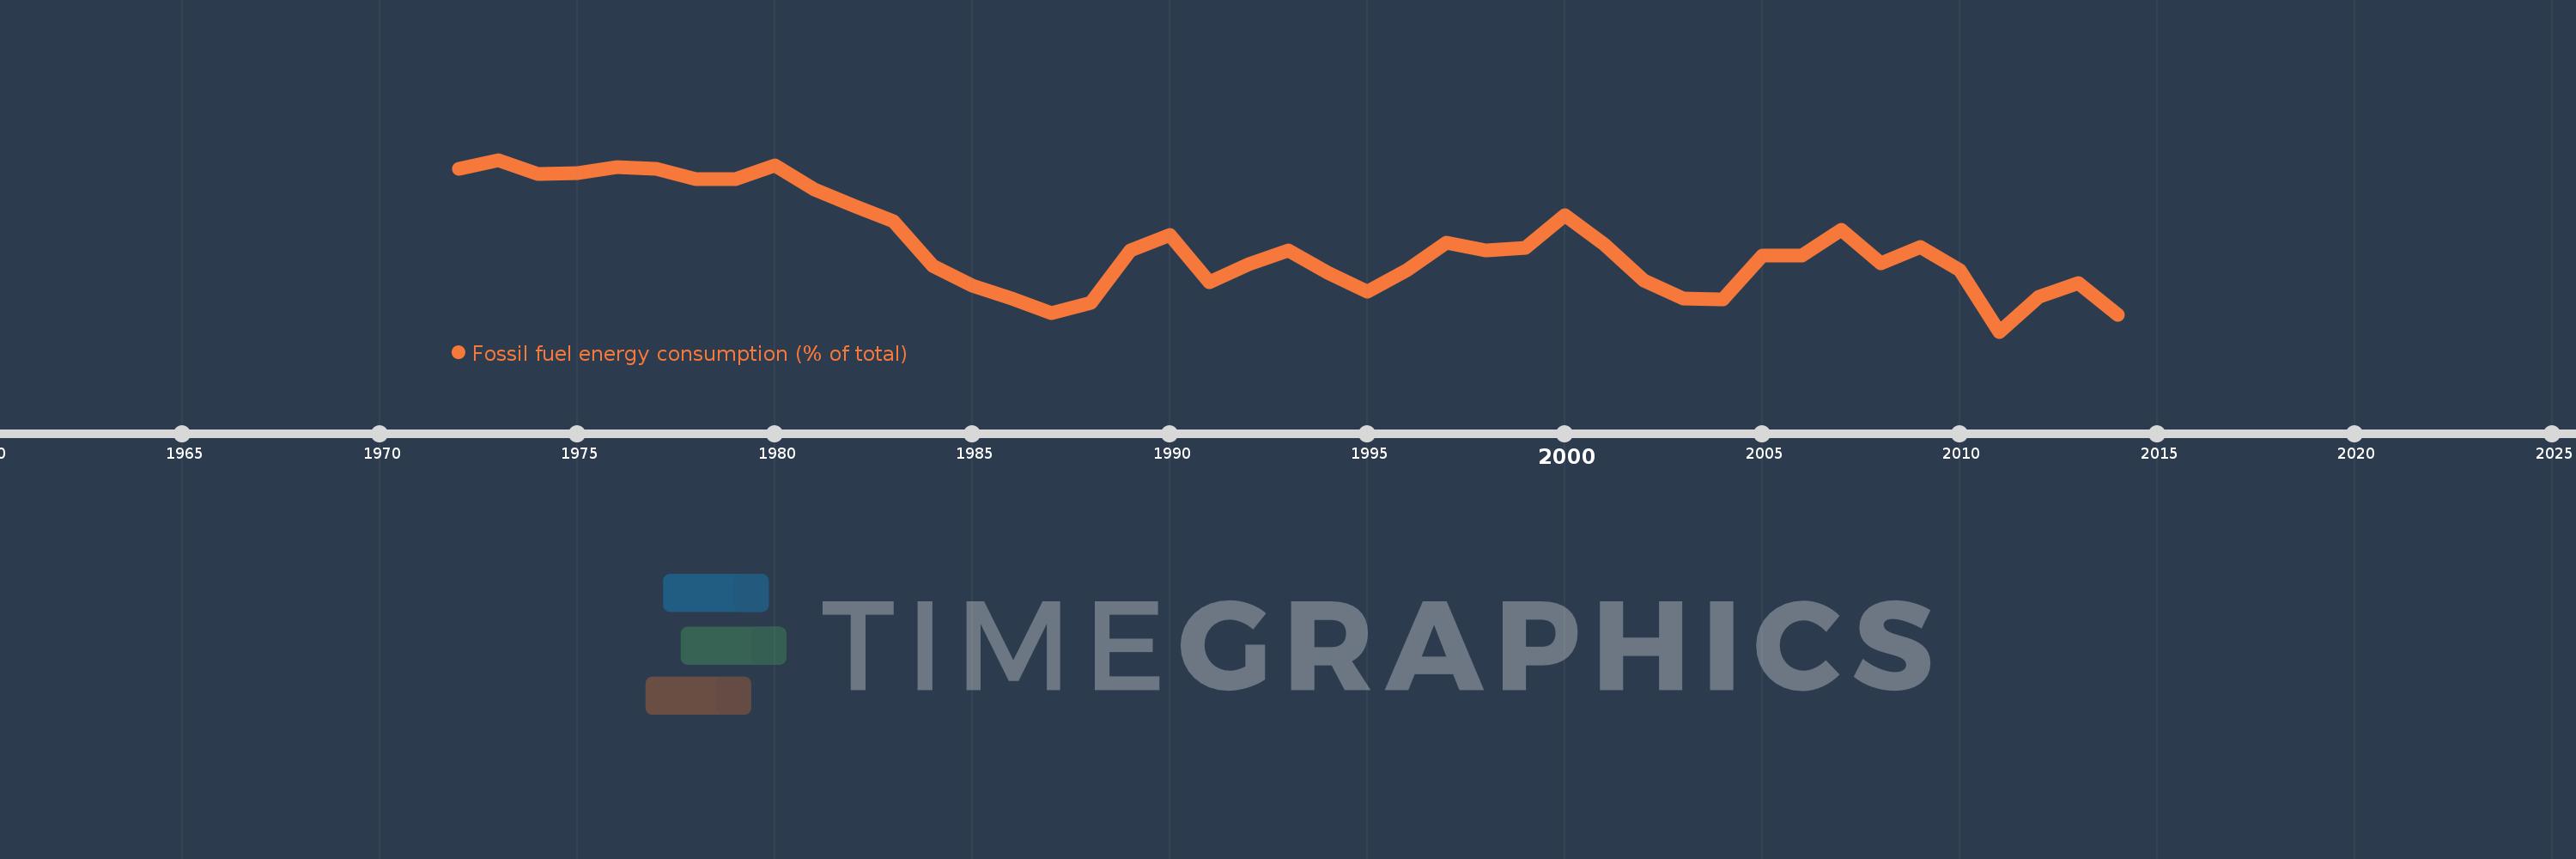
Fossil fuel energy consumption (% of total)
2014,2013,2012,2011,2010,2009,2008,2007,2006,2005,2004,2003,2002,2001,2000,1999,1998,1997,1996,1995,1994,1993,1992,1991,1990,1989,1988,1987,1986,1985,1984,1983,1982,1981,1980,1979,1978,1977,1976,1975,1974,1973,1972
Estas estadísticas en otros países:
AlbaniaAlgeriaAngolaAntigua and BarbudaArab WorldArgentinaArmeniaAustraliaAustriaAzerbaijanBahamas, TheBahrainBangladeshBarbadosBelarusBelgiumBelizeBeninBhutanBoliviaBosnia and HerzegovinaBotswanaBrazilBrunei DarussalamBulgariaCabo VerdeCambodiaCameroonCanadaCaribbean small statesCentral Europe and the BalticsChileChinaColombiaComorosCongo, Dem. Rep.Congo, Rep.Costa RicaCote d'IvoireCroatiaCubaCuracaoCyprusCzech RepublicDenmarkDjiboutiDominicaDominican RepublicEarly-demographic dividendEast Asia & PacificEast Asia & Pacific (excluding high income)East Asia & Pacific (IDA & IBRD countries)EcuadorEgypt, Arab Rep.El SalvadorEquatorial GuineaEritreaEstoniaEthiopiaEuro areaEurope & Central AsiaEurope & Central Asia (excluding high income)Europe & Central Asia (IDA & IBRD countries)European UnionFijiFinlandFragile and conflict affected situationsFranceGabonGambia, TheGeorgiaGermanyGhanaGibraltarGreeceGrenadaGuatemalaGuinea-BissauGuyanaHaitiHeavily indebted poor countries (HIPC)High incomeHondurasHong Kong SAR, ChinaHungaryIBRD onlyIcelandIDA & IBRD totalIDA blendIDA onlyIDA totalIndiaIndonesiaIran, Islamic Rep.IraqIrelandIsraelItalyJamaicaJapanJordanKazakhstanKenyaKiribatiKorea, Dem. People’s Rep.Korea, Rep.KosovoKuwaitKyrgyz RepublicLate-demographic dividendLatin America & Caribbean Latin America & Caribbean (excluding high income)Latin America & the Caribbean (IDA & IBRD countries)LatviaLeast developed countries: UN classificationLebanonLesothoLibyaLithuaniaLow & middle incomeLow incomeLower middle incomeLuxembourgMacedonia, FYRMalaysiaMaldivesMaltaMarshall IslandsMauritiusMexicoMiddle East & North AfricaMiddle East & North Africa (excluding high income)Middle East & North Africa (IDA & IBRD countries)Middle incomeMoldovaMongoliaMontenegroMoroccoMozambiqueMyanmarNamibiaNepalNetherlandsNew ZealandNicaraguaNigerNigeriaNorth AmericaNorwayOECD membersOmanOther small statesPacific island small statesPakistanPalauPanamaParaguayPeruPhilippinesPolandPortugalPost-demographic dividendPre-demographic dividendQatarRomaniaRussian FederationSamoaSao Tome and PrincipeSaudi ArabiaSenegalSerbiaSeychellesSingaporeSlovak RepublicSloveniaSmall statesSolomon IslandsSouth AfricaSouth AsiaSouth Asia (IDA & IBRD)South SudanSpainSri LankaSt. Kitts and NevisSt. LuciaSt. Vincent and the GrenadinesSub-Saharan Africa Sub-Saharan Africa (excluding high income)Sub-Saharan Africa (IDA & IBRD countries)SudanSurinameSwazilandSwedenSwitzerlandSyrian Arab RepublicTajikistanTanzaniaThailandTimor-LesteTogoTongaTrinidad and TobagoTunisiaTurkeyUkraineUnited Arab EmiratesUnited KingdomUnited StatesUpper middle incomeUruguayUzbekistanVanuatuVenezuela, RBVietnamWorldYemen, Rep.ZambiaZimbabwe línea de tiempo (timeline):
En esta escala de tiempo se presenta un gráfico de 1972 y 2014 de Uruguay. Los datos de 1971 están ausentes. El número de observaciones reales por fecha: 43.
Fuente (nombre):
Indicadores del desarrollo mundial
Fuente (organización):
IEA Statistics © OECD/IEA 2014 (http://www.iea.org/stats/index.asp), subject to https://www.iea.org/t&c/termsandconditions/
Categorías:
Energy & Mining
Se ha actualizado:
23 abr 2017 año
Los indicadores de los cambios de valor en los últimos años
Mínimo:
50.03
1 ene 2011 año
Máximo:
79.883
1 ene 1973 año
A la fecha de observación
Valor
Cambio absoluto
El cambio con respecto al valor anterior
1 ene 1972 año
78.374
+78.374
0.0%
1 ene 1973 año
79.883
+1.509
1.93%
1 ene 1974 año
77.368
-2.515
-3.15%
1 ene 1975 año
77.607
+0.239
0.31%
1 ene 1976 año
78.618
+1.012
1.3%
1 ene 1977 año
78.267
-0.351
-0.45%
1 ene 1978 año
76.523
-1.744
-2.23%
1 ene 1979 año
76.511
-0.011
-0.01%
1 ene 1980 año
78.961
+2.45
3.2%
1 ene 1981 año
74.667
-4.294
-5.44%
1 ene 1982 año
71.86
-2.807
-3.76%
1 ene 1983 año
69.155
-2.705
-3.76%
1 ene 1984 año
61.475
-7.68
-11.1%
1 ene 1985 año
57.997
-3.478
-5.66%
1 ene 1986 año
55.749
-2.248
-3.88%
1 ene 1987 año
53.254
-2.495
-4.48%
1 ene 1988 año
55.036
+1.782
3.35%
1 ene 1989 año
64.066
+9.03
16.41%
1 ene 1990 año
66.797
+2.732
4.26%
1 ene 1991 año
58.67
-8.127
-12.17%
1 ene 1992 año
61.711
+3.041
5.18%
1 ene 1993 año
64.064
+2.353
3.81%
1 ene 1994 año
60.273
-3.791
-5.92%
1 ene 1995 año
56.917
-3.356
-5.57%
1 ene 1996 año
60.723
+3.806
6.69%
1 ene 1997 año
65.509
+4.787
7.88%
1 ene 1998 año
64.147
-1.362
-2.08%
1 ene 1999 año
64.622
+0.475
0.74%
1 ene 2000 año
70.246
+5.623
8.7%
1 ene 2001 año
65.173
-5.073
-7.22%
1 ene 2002 año
58.887
-6.285
-9.64%
1 ene 2003 año
55.79
-3.097
-5.26%
1 ene 2004 año
55.634
-0.156
-0.28%
1 ene 2005 año
63.251
+7.616
13.69%
1 ene 2006 año
63.277
+0.027
0.04%
1 ene 2007 año
67.706
+4.428
7.0%
1 ene 2008 año
61.875
-5.831
-8.61%
1 ene 2009 año
64.702
+2.827
4.57%
1 ene 2010 año
60.639
-4.063
-6.28%
1 ene 2011 año
50.03
-10.609
-17.5%
1 ene 2012 año
56.067
+6.037
12.07%
1 ene 2013 año
58.411
+2.344
4.18%
1 ene 2014 año
52.897
-5.514
-9.44%
Ranking de los países por los datos estadísticos actuales


Comentarios: