29
/es/
es
AIzaSyAYiBZKx7MnpbEhh9jyipgxe19OcubqV5w
April 1, 2024
101075
Canada
CAN
true
2
1
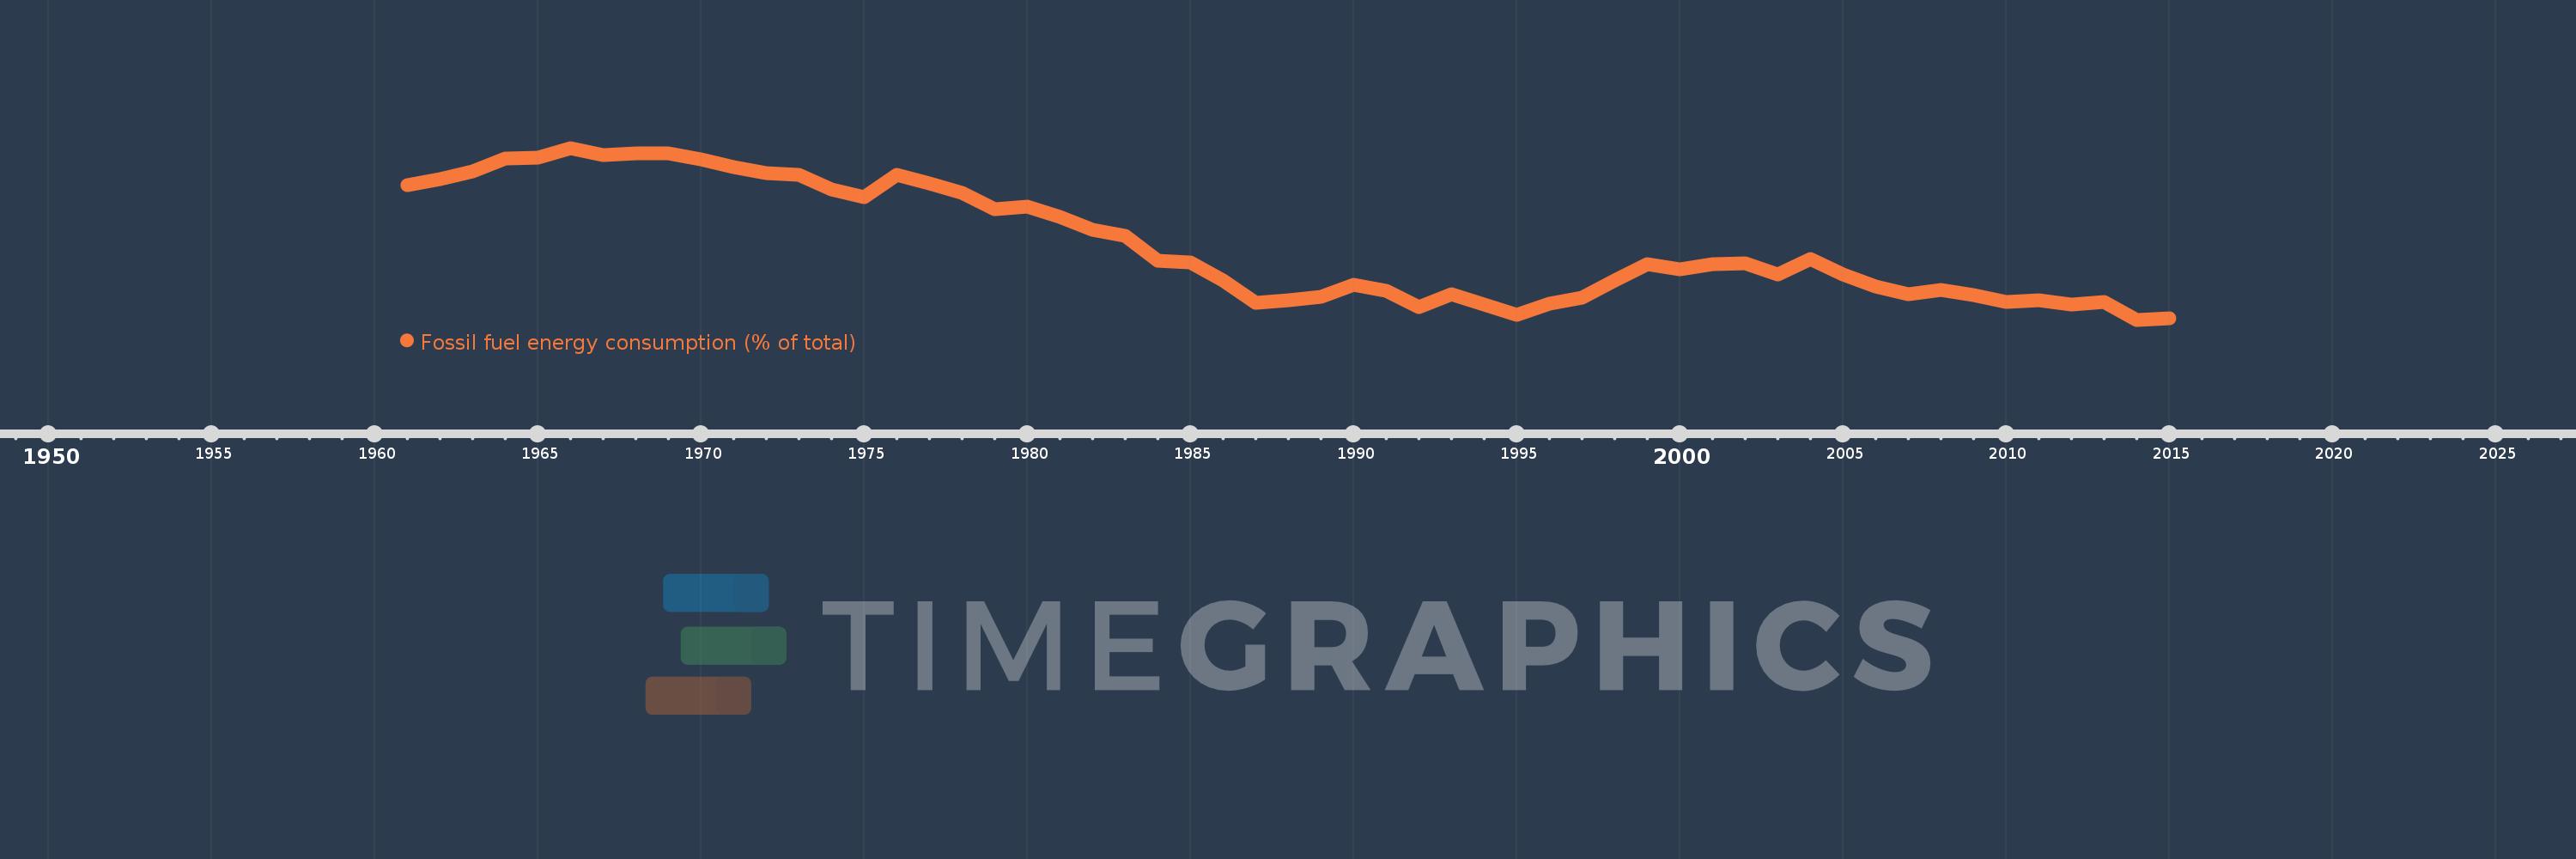
Fossil fuel energy consumption (% of total)
2015,2014,2013,2012,2011,2010,2009,2008,2007,2006,2005,2004,2003,2002,2001,2000,1999,1998,1997,1996,1995,1994,1993,1992,1991,1990,1989,1988,1987,1986,1985,1984,1983,1982,1981,1980,1979,1978,1977,1976,1975,1974,1973,1972,1971,1970,1969,1968,1967,1966,1965,1964,1963,1962,1961
Estas estadísticas en otros países:
AlbaniaAlgeriaAngolaAntigua and BarbudaArab WorldArgentinaArmeniaAustraliaAustriaAzerbaijanBahamas, TheBahrainBangladeshBarbadosBelarusBelgiumBelizeBeninBhutanBoliviaBosnia and HerzegovinaBotswanaBrazilBrunei DarussalamBulgariaCabo VerdeCambodiaCameroonCanadaCaribbean small statesCentral Europe and the BalticsChileChinaColombiaComorosCongo, Dem. Rep.Congo, Rep.Costa RicaCote d'IvoireCroatiaCubaCuracaoCyprusCzech RepublicDenmarkDjiboutiDominicaDominican RepublicEarly-demographic dividendEast Asia & PacificEast Asia & Pacific (excluding high income)East Asia & Pacific (IDA & IBRD countries)EcuadorEgypt, Arab Rep.El SalvadorEquatorial GuineaEritreaEstoniaEthiopiaEuro areaEurope & Central AsiaEurope & Central Asia (excluding high income)Europe & Central Asia (IDA & IBRD countries)European UnionFijiFinlandFragile and conflict affected situationsFranceGabonGambia, TheGeorgiaGermanyGhanaGibraltarGreeceGrenadaGuatemalaGuinea-BissauGuyanaHaitiHeavily indebted poor countries (HIPC)High incomeHondurasHong Kong SAR, ChinaHungaryIBRD onlyIcelandIDA & IBRD totalIDA blendIDA onlyIDA totalIndiaIndonesiaIran, Islamic Rep.IraqIrelandIsraelItalyJamaicaJapanJordanKazakhstanKenyaKiribatiKorea, Dem. People’s Rep.Korea, Rep.KosovoKuwaitKyrgyz RepublicLate-demographic dividendLatin America & Caribbean Latin America & Caribbean (excluding high income)Latin America & the Caribbean (IDA & IBRD countries)LatviaLeast developed countries: UN classificationLebanonLesothoLibyaLithuaniaLow & middle incomeLow incomeLower middle incomeLuxembourgMacedonia, FYRMalaysiaMaldivesMaltaMarshall IslandsMauritiusMexicoMiddle East & North AfricaMiddle East & North Africa (excluding high income)Middle East & North Africa (IDA & IBRD countries)Middle incomeMoldovaMongoliaMontenegroMoroccoMozambiqueMyanmarNamibiaNepalNetherlandsNew ZealandNicaraguaNigerNigeriaNorth AmericaNorwayOECD membersOmanOther small statesPacific island small statesPakistanPalauPanamaParaguayPeruPhilippinesPolandPortugalPost-demographic dividendPre-demographic dividendQatarRomaniaRussian FederationSamoaSao Tome and PrincipeSaudi ArabiaSenegalSerbiaSeychellesSingaporeSlovak RepublicSloveniaSmall statesSolomon IslandsSouth AfricaSouth AsiaSouth Asia (IDA & IBRD)South SudanSpainSri LankaSt. Kitts and NevisSt. LuciaSt. Vincent and the GrenadinesSub-Saharan Africa Sub-Saharan Africa (excluding high income)Sub-Saharan Africa (IDA & IBRD countries)SudanSurinameSwazilandSwedenSwitzerlandSyrian Arab RepublicTajikistanTanzaniaThailandTimor-LesteTogoTongaTrinidad and TobagoTunisiaTurkeyUkraineUnited Arab EmiratesUnited KingdomUnited StatesUpper middle incomeUruguayUzbekistanVanuatuVenezuela, RBVietnamWorldYemen, Rep.ZambiaZimbabwe línea de tiempo (timeline):
En esta escala de tiempo se presenta un gráfico de 1961 y 2015 de Canada. Los datos de 1960 están ausentes. El número de observaciones reales por fecha: 55.
Fuente (nombre):
Indicadores del desarrollo mundial
Fuente (organización):
IEA Statistics © OECD/IEA 2014 (http://www.iea.org/stats/index.asp), subject to https://www.iea.org/t&c/termsandconditions/
Categorías:
Energy & Mining
Se ha actualizado:
23 abr 2017 año
Los indicadores de los cambios de valor en los últimos años
Mínimo:
72.185
1 ene 2014 año
Máximo:
86.215
1 ene 1966 año
A la fecha de observación
Valor
Cambio absoluto
El cambio con respecto al valor anterior
1 ene 1961 año
83.192
+83.192
0.0%
1 ene 1962 año
83.655
+0.462
0.56%
1 ene 1963 año
84.333
+0.678
0.81%
1 ene 1964 año
85.344
+1.011
1.2%
1 ene 1965 año
85.42
+0.076
0.09%
1 ene 1966 año
86.215
+0.795
0.93%
1 ene 1967 año
85.666
-0.549
-0.64%
1 ene 1968 año
85.798
+0.132
0.15%
1 ene 1969 año
85.758
-0.04
-0.05%
1 ene 1970 año
85.261
-0.497
-0.58%
1 ene 1971 año
84.662
-0.599
-0.7%
1 ene 1972 año
84.154
-0.508
-0.6%
1 ene 1973 año
84.024
-0.13
-0.15%
1 ene 1974 año
82.793
-1.231
-1.47%
1 ene 1975 año
82.206
-0.588
-0.71%
1 ene 1976 año
84.054
+1.849
2.25%
1 ene 1977 año
83.304
-0.75
-0.89%
1 ene 1978 año
82.516
-0.789
-0.95%
1 ene 1979 año
81.227
-1.289
-1.56%
1 ene 1980 año
81.429
+0.202
0.25%
1 ene 1981 año
80.564
-0.865
-1.06%
1 ene 1982 año
79.514
-1.05
-1.3%
1 ene 1983 año
79.067
-0.447
-0.56%
1 ene 1984 año
77.009
-2.057
-2.6%
1 ene 1985 año
76.849
-0.16
-0.21%
1 ene 1986 año
75.407
-1.442
-1.88%
1 ene 1987 año
73.564
-1.843
-2.44%
1 ene 1988 año
73.795
+0.231
0.31%
1 ene 1989 año
74.023
+0.228
0.31%
1 ene 1990 año
75.052
+1.029
1.39%
1 ene 1991 año
74.565
-0.486
-0.65%
1 ene 1992 año
73.202
-1.364
-1.83%
1 ene 1993 año
74.264
+1.063
1.45%
1 ene 1994 año
73.434
-0.83
-1.12%
1 ene 1995 año
72.551
-0.883
-1.2%
1 ene 1996 año
73.488
+0.937
1.29%
1 ene 1997 año
73.974
+0.486
0.66%
1 ene 1998 año
75.382
+1.409
1.9%
1 ene 1999 año
76.714
+1.331
1.77%
1 ene 2000 año
76.308
-0.406
-0.53%
1 ene 2001 año
76.758
+0.45
0.59%
1 ene 2002 año
76.789
+0.031
0.04%
1 ene 2003 año
75.86
-0.929
-1.21%
1 ene 2004 año
77.12
+1.26
1.66%
1 ene 2005 año
75.903
-1.217
-1.58%
1 ene 2006 año
74.887
-1.017
-1.34%
1 ene 2007 año
74.302
-0.585
-0.78%
1 ene 2008 año
74.598
+0.296
0.4%
1 ene 2009 año
74.166
-0.433
-0.58%
1 ene 2010 año
73.639
-0.526
-0.71%
1 ene 2011 año
73.786
+0.147
0.2%
1 ene 2012 año
73.426
-0.36
-0.49%
1 ene 2013 año
73.623
+0.196
0.27%
1 ene 2014 año
72.185
-1.438
-1.95%
1 ene 2015 año
72.314
+0.129
0.18%
Ranking de los países por los datos estadísticos actuales


Comentarios: