29
/es/
es
AIzaSyAYiBZKx7MnpbEhh9jyipgxe19OcubqV5w
April 1, 2024
55517
Pre-demographic dividend
PRE
false
2
1
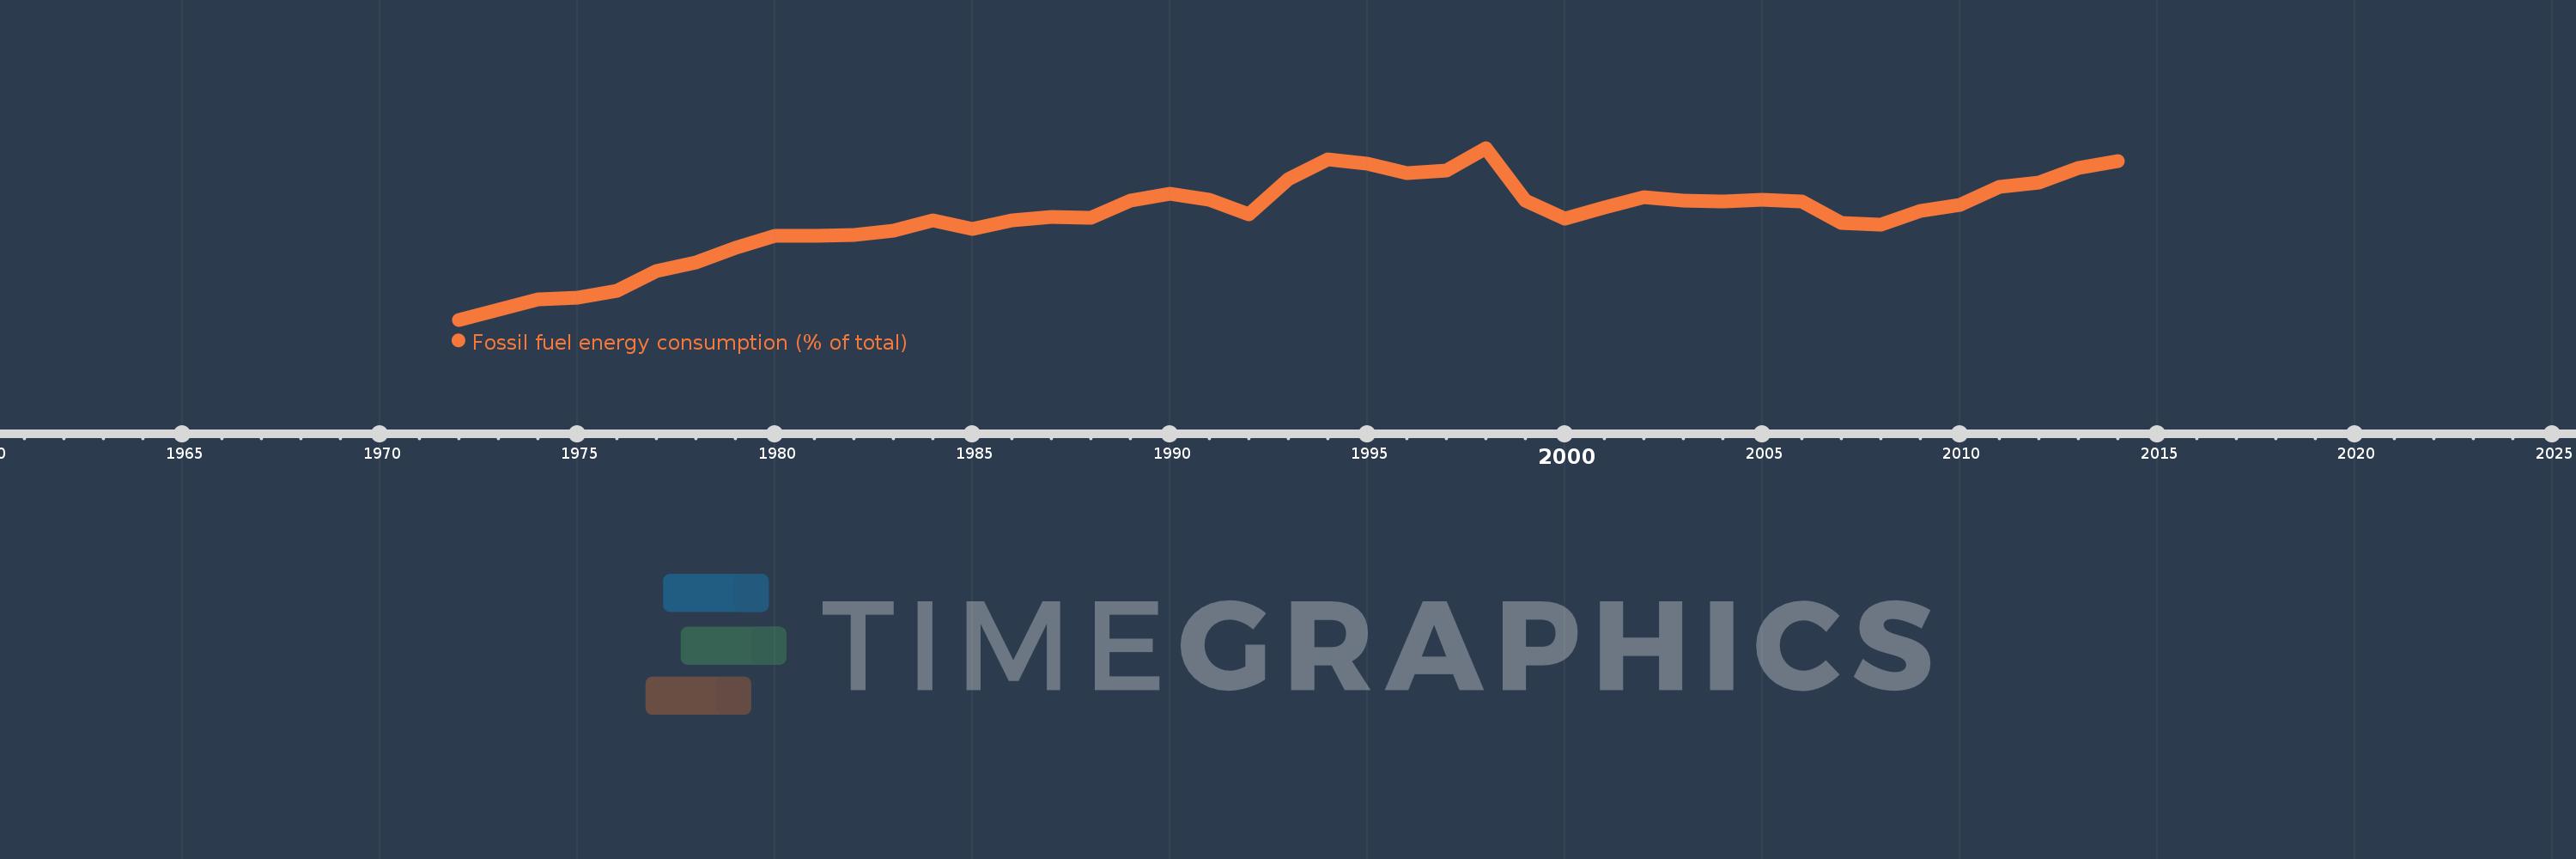
Fossil fuel energy consumption (% of total)
2014,2013,2012,2011,2010,2009,2008,2007,2006,2005,2004,2003,2002,2001,2000,1999,1998,1997,1996,1995,1994,1993,1992,1991,1990,1989,1988,1987,1986,1985,1984,1983,1982,1981,1980,1979,1978,1977,1976,1975,1974,1973,1972
Estas estadísticas en otros países:
AlbaniaAlgeriaAngolaAntigua and BarbudaArab WorldArgentinaArmeniaAustraliaAustriaAzerbaijanBahamas, TheBahrainBangladeshBarbadosBelarusBelgiumBelizeBeninBhutanBoliviaBosnia and HerzegovinaBotswanaBrazilBrunei DarussalamBulgariaCabo VerdeCambodiaCameroonCanadaCaribbean small statesCentral Europe and the BalticsChileChinaColombiaComorosCongo, Dem. Rep.Congo, Rep.Costa RicaCote d'IvoireCroatiaCubaCuracaoCyprusCzech RepublicDenmarkDjiboutiDominicaDominican RepublicEarly-demographic dividendEast Asia & PacificEast Asia & Pacific (excluding high income)East Asia & Pacific (IDA & IBRD countries)EcuadorEgypt, Arab Rep.El SalvadorEquatorial GuineaEritreaEstoniaEthiopiaEuro areaEurope & Central AsiaEurope & Central Asia (excluding high income)Europe & Central Asia (IDA & IBRD countries)European UnionFijiFinlandFragile and conflict affected situationsFranceGabonGambia, TheGeorgiaGermanyGhanaGibraltarGreeceGrenadaGuatemalaGuinea-BissauGuyanaHaitiHeavily indebted poor countries (HIPC)High incomeHondurasHong Kong SAR, ChinaHungaryIBRD onlyIcelandIDA & IBRD totalIDA blendIDA onlyIDA totalIndiaIndonesiaIran, Islamic Rep.IraqIrelandIsraelItalyJamaicaJapanJordanKazakhstanKenyaKiribatiKorea, Dem. People’s Rep.Korea, Rep.KosovoKuwaitKyrgyz RepublicLate-demographic dividendLatin America & Caribbean Latin America & Caribbean (excluding high income)Latin America & the Caribbean (IDA & IBRD countries)LatviaLeast developed countries: UN classificationLebanonLesothoLibyaLithuaniaLow & middle incomeLow incomeLower middle incomeLuxembourgMacedonia, FYRMalaysiaMaldivesMaltaMarshall IslandsMauritiusMexicoMiddle East & North AfricaMiddle East & North Africa (excluding high income)Middle East & North Africa (IDA & IBRD countries)Middle incomeMoldovaMongoliaMontenegroMoroccoMozambiqueMyanmarNamibiaNepalNetherlandsNew ZealandNicaraguaNigerNigeriaNorth AmericaNorwayOECD membersOmanOther small statesPacific island small statesPakistanPalauPanamaParaguayPeruPhilippinesPolandPortugalPost-demographic dividendPre-demographic dividendQatarRomaniaRussian FederationSamoaSao Tome and PrincipeSaudi ArabiaSenegalSerbiaSeychellesSingaporeSlovak RepublicSloveniaSmall statesSolomon IslandsSouth AfricaSouth AsiaSouth Asia (IDA & IBRD)South SudanSpainSri LankaSt. Kitts and NevisSt. LuciaSt. Vincent and the GrenadinesSub-Saharan Africa Sub-Saharan Africa (excluding high income)Sub-Saharan Africa (IDA & IBRD countries)SudanSurinameSwazilandSwedenSwitzerlandSyrian Arab RepublicTajikistanTanzaniaThailandTimor-LesteTogoTongaTrinidad and TobagoTunisiaTurkeyUkraineUnited Arab EmiratesUnited KingdomUnited StatesUpper middle incomeUruguayUzbekistanVanuatuVenezuela, RBVietnamWorldYemen, Rep.ZambiaZimbabwe línea de tiempo (timeline):
En esta escala de tiempo se presenta un gráfico de 1972 y 2014 de Pre-demographic dividend. Los datos de 1971 están ausentes. El número de observaciones reales por fecha: 43.
Fuente (nombre):
Indicadores del desarrollo mundial
Fuente (organización):
IEA Statistics © OECD/IEA 2014 (http://www.iea.org/stats/index.asp), subject to https://www.iea.org/t&c/termsandconditions/
Categorías:
Energy & Mining
Se ha actualizado:
23 abr 2017 año
Los indicadores de los cambios de valor en los últimos años
Mínimo:
16.545
1 ene 1972 año
Máximo:
32.644
1 ene 1998 año
A la fecha de observación
Valor
Cambio absoluto
El cambio con respecto al valor anterior
1 ene 1972 año
16.545
+16.545
0.0%
1 ene 1973 año
17.49
+0.945
5.71%
1 ene 1974 año
18.423
+0.933
5.33%
1 ene 1975 año
18.625
+0.202
1.1%
1 ene 1976 año
19.249
+0.624
3.35%
1 ene 1977 año
21.089
+1.84
9.56%
1 ene 1978 año
21.934
+0.845
4.01%
1 ene 1979 año
23.258
+1.324
6.04%
1 ene 1980 año
24.436
+1.178
5.06%
1 ene 1981 año
24.402
-0.034
-0.14%
1 ene 1982 año
24.459
+0.058
0.24%
1 ene 1983 año
24.885
+0.426
1.74%
1 ene 1984 año
25.854
+0.969
3.89%
1 ene 1985 año
25.084
-0.77
-2.98%
1 ene 1986 año
25.859
+0.775
3.09%
1 ene 1987 año
26.208
+0.349
1.35%
1 ene 1988 año
26.081
-0.127
-0.48%
1 ene 1989 año
27.724
+1.642
6.3%
1 ene 1990 año
28.35
+0.626
2.26%
1 ene 1991 año
27.775
-0.575
-2.03%
1 ene 1992 año
26.39
-1.385
-4.99%
1 ene 1993 año
29.729
+3.339
12.65%
1 ene 1994 año
31.576
+1.847
6.21%
1 ene 1995 año
31.133
-0.444
-1.4%
1 ene 1996 año
30.264
-0.869
-2.79%
1 ene 1997 año
30.531
+0.267
0.88%
1 ene 1998 año
32.644
+2.112
6.92%
1 ene 1999 año
27.688
-4.956
-15.18%
1 ene 2000 año
26.018
-1.67
-6.03%
1 ene 2001 año
27.064
+1.046
4.02%
1 ene 2002 año
28.041
+0.977
3.61%
1 ene 2003 año
27.711
-0.331
-1.18%
1 ene 2004 año
27.617
-0.093
-0.34%
1 ene 2005 año
27.822
+0.204
0.74%
1 ene 2006 año
27.613
-0.209
-0.75%
1 ene 2007 año
25.598
-2.015
-7.3%
1 ene 2008 año
25.49
-0.109
-0.42%
1 ene 2009 año
26.722
+1.232
4.83%
1 ene 2010 año
27.336
+0.614
2.3%
1 ene 2011 año
29.004
+1.669
6.1%
1 ene 2012 año
29.367
+0.362
1.25%
1 ene 2013 año
30.767
+1.4
4.77%
1 ene 2014 año
31.426
+0.658
2.14%
Ranking de los países por los datos estadísticos actuales


Comentarios: