29
/es/
es
AIzaSyAYiBZKx7MnpbEhh9jyipgxe19OcubqV5w
April 1, 2024
207927
Netherlands
NLD
true
2
1
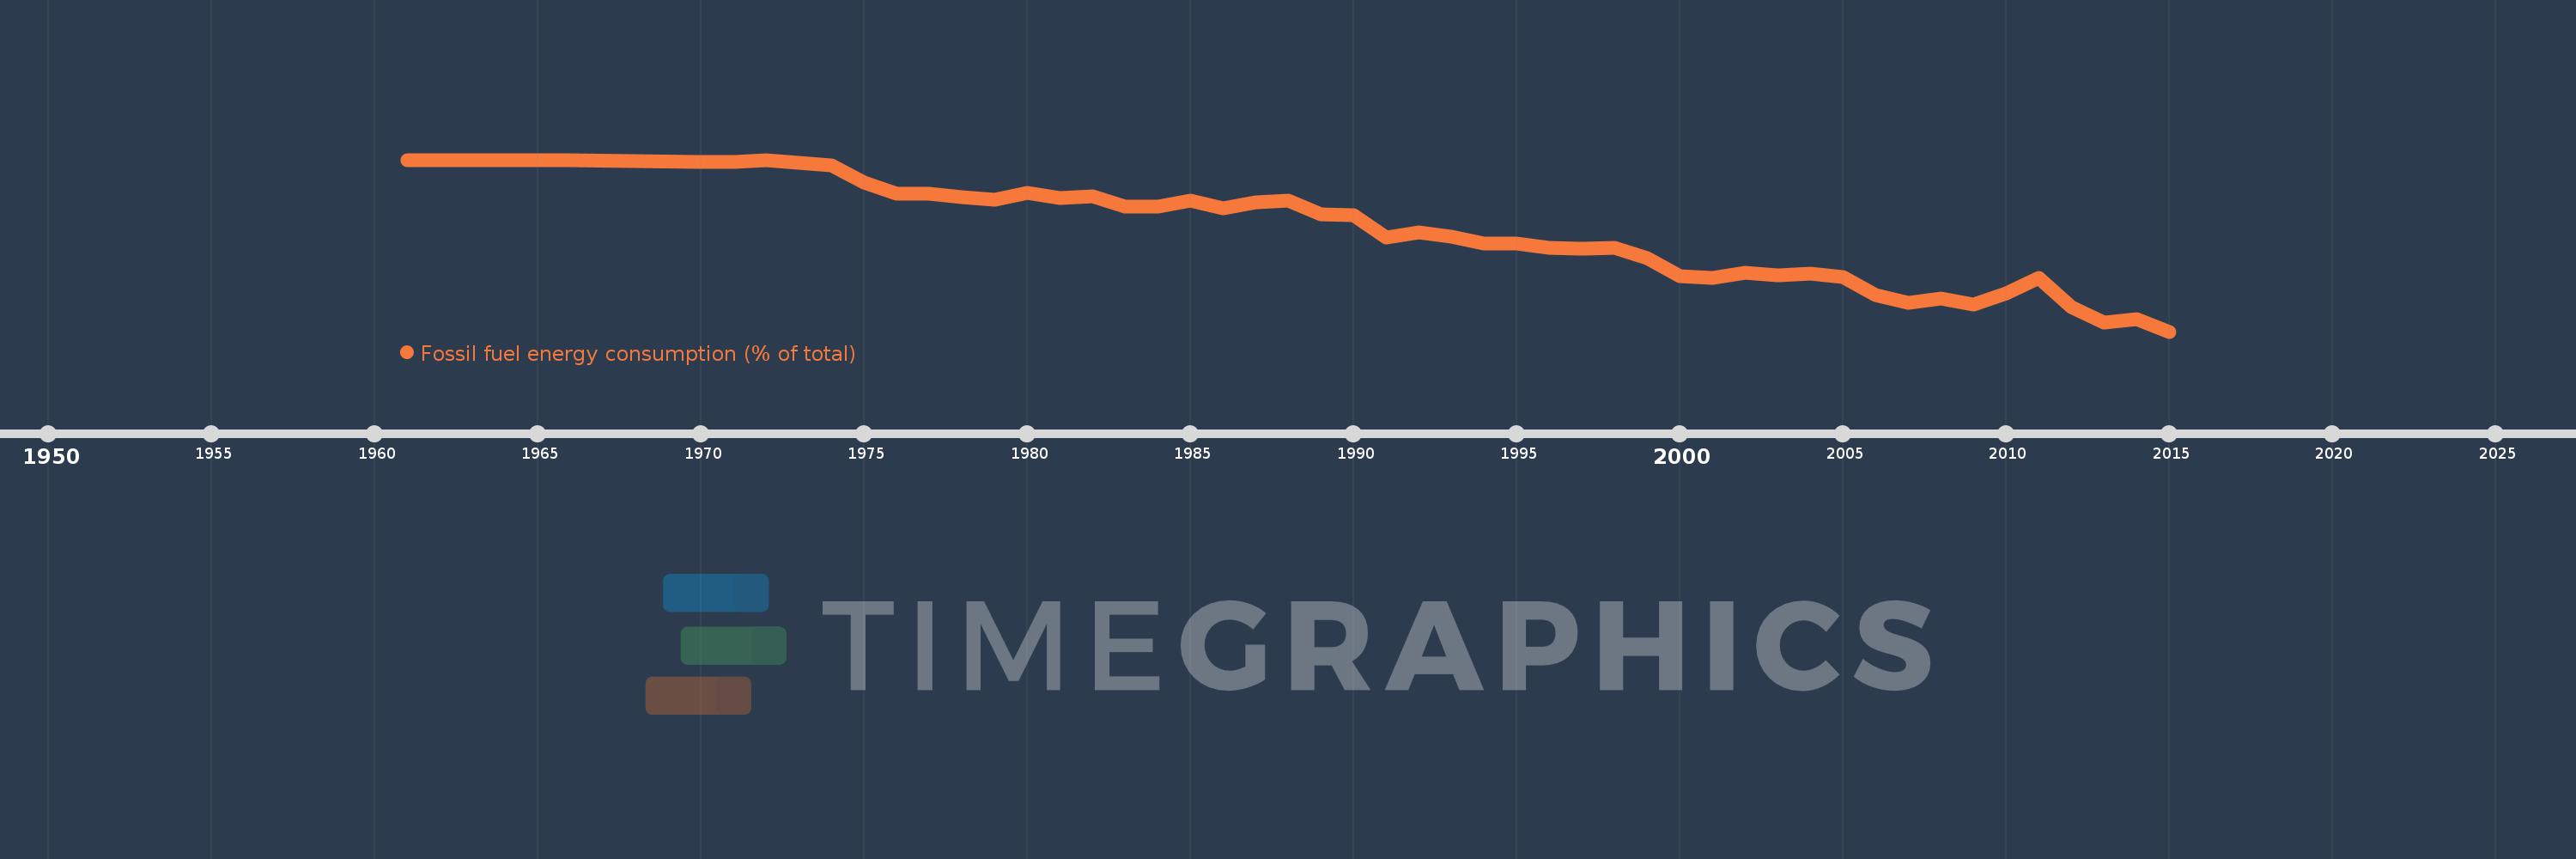
Fossil fuel energy consumption (% of total)
2015,2014,2013,2012,2011,2010,2009,2008,2007,2006,2005,2004,2003,2002,2001,2000,1999,1998,1997,1996,1995,1994,1993,1992,1991,1990,1989,1988,1987,1986,1985,1984,1983,1982,1981,1980,1979,1978,1977,1976,1975,1974,1972,1971,1970,1966,1965,1964,1962,1961
Estas estadísticas en otros países:
AlbaniaAlgeriaAngolaAntigua and BarbudaArab WorldArgentinaArmeniaAustraliaAustriaAzerbaijanBahamas, TheBahrainBangladeshBarbadosBelarusBelgiumBelizeBeninBhutanBoliviaBosnia and HerzegovinaBotswanaBrazilBrunei DarussalamBulgariaCabo VerdeCambodiaCameroonCanadaCaribbean small statesCentral Europe and the BalticsChileChinaColombiaComorosCongo, Dem. Rep.Congo, Rep.Costa RicaCote d'IvoireCroatiaCubaCuracaoCyprusCzech RepublicDenmarkDjiboutiDominicaDominican RepublicEarly-demographic dividendEast Asia & PacificEast Asia & Pacific (excluding high income)East Asia & Pacific (IDA & IBRD countries)EcuadorEgypt, Arab Rep.El SalvadorEquatorial GuineaEritreaEstoniaEthiopiaEuro areaEurope & Central AsiaEurope & Central Asia (excluding high income)Europe & Central Asia (IDA & IBRD countries)European UnionFijiFinlandFragile and conflict affected situationsFranceGabonGambia, TheGeorgiaGermanyGhanaGibraltarGreeceGrenadaGuatemalaGuinea-BissauGuyanaHaitiHeavily indebted poor countries (HIPC)High incomeHondurasHong Kong SAR, ChinaHungaryIBRD onlyIcelandIDA & IBRD totalIDA blendIDA onlyIDA totalIndiaIndonesiaIran, Islamic Rep.IraqIrelandIsraelItalyJamaicaJapanJordanKazakhstanKenyaKiribatiKorea, Dem. People’s Rep.Korea, Rep.KosovoKuwaitKyrgyz RepublicLate-demographic dividendLatin America & Caribbean Latin America & Caribbean (excluding high income)Latin America & the Caribbean (IDA & IBRD countries)LatviaLeast developed countries: UN classificationLebanonLesothoLibyaLithuaniaLow & middle incomeLow incomeLower middle incomeLuxembourgMacedonia, FYRMalaysiaMaldivesMaltaMarshall IslandsMauritiusMexicoMiddle East & North AfricaMiddle East & North Africa (excluding high income)Middle East & North Africa (IDA & IBRD countries)Middle incomeMoldovaMongoliaMontenegroMoroccoMozambiqueMyanmarNamibiaNepalNetherlandsNew ZealandNicaraguaNigerNigeriaNorth AmericaNorwayOECD membersOmanOther small statesPacific island small statesPakistanPalauPanamaParaguayPeruPhilippinesPolandPortugalPost-demographic dividendPre-demographic dividendQatarRomaniaRussian FederationSamoaSao Tome and PrincipeSaudi ArabiaSenegalSerbiaSeychellesSingaporeSlovak RepublicSloveniaSmall statesSolomon IslandsSouth AfricaSouth AsiaSouth Asia (IDA & IBRD)South SudanSpainSri LankaSt. Kitts and NevisSt. LuciaSt. Vincent and the GrenadinesSub-Saharan Africa Sub-Saharan Africa (excluding high income)Sub-Saharan Africa (IDA & IBRD countries)SudanSurinameSwazilandSwedenSwitzerlandSyrian Arab RepublicTajikistanTanzaniaThailandTimor-LesteTogoTongaTrinidad and TobagoTunisiaTurkeyUkraineUnited Arab EmiratesUnited KingdomUnited StatesUpper middle incomeUruguayUzbekistanVanuatuVenezuela, RBVietnamWorldYemen, Rep.ZambiaZimbabwe línea de tiempo (timeline):
En esta escala de tiempo se presenta un gráfico de 1961 y 2015 de Netherlands. Los datos de 1960 están ausentes. El número de observaciones reales por fecha: 50.
Fuente (nombre):
Indicadores del desarrollo mundial
Fuente (organización):
IEA Statistics © OECD/IEA 2014 (http://www.iea.org/stats/index.asp), subject to https://www.iea.org/t&c/termsandconditions/
Categorías:
Energy & Mining
Se ha actualizado:
23 abr 2017 año
Los indicadores de los cambios de valor en los últimos años
Mínimo:
91.054
1 ene 2015 año
Máximo:
99.995
1 ene 1965 año
A la fecha de observación
Valor
Cambio absoluto
El cambio con respecto al valor anterior
1 ene 1961 año
99.952
+99.952
0.0%
1 ene 1962 año
99.983
+0.031
0.03%
1 ene 1964 año
99.985
+0.002
0.0%
1 ene 1965 año
99.995
+0.009
0.01%
1 ene 1966 año
99.99
-0.004
0.0%
1 ene 1970 año
99.882
-0.109
-0.11%
1 ene 1971 año
99.864
-0.017
-0.02%
1 ene 1972 año
99.975
+0.111
0.11%
1 ene 1974 año
99.721
-0.255
-0.25%
1 ene 1975 año
98.808
-0.913
-0.92%
1 ene 1976 año
98.244
-0.564
-0.57%
1 ene 1977 año
98.213
-0.031
-0.03%
1 ene 1978 año
98.05
-0.163
-0.17%
1 ene 1979 año
97.907
-0.143
-0.15%
1 ene 1980 año
98.294
+0.387
0.4%
1 ene 1981 año
97.988
-0.306
-0.31%
1 ene 1982 año
98.115
+0.127
0.13%
1 ene 1983 año
97.563
-0.552
-0.56%
1 ene 1984 año
97.55
-0.013
-0.01%
1 ene 1985 año
97.877
+0.327
0.33%
1 ene 1986 año
97.456
-0.421
-0.43%
1 ene 1987 año
97.785
+0.329
0.34%
1 ene 1988 año
97.863
+0.078
0.08%
1 ene 1989 año
97.151
-0.712
-0.73%
1 ene 1990 año
97.126
-0.025
-0.03%
1 ene 1991 año
95.932
-1.194
-1.23%
1 ene 1992 año
96.199
+0.267
0.28%
1 ene 1993 año
95.986
-0.213
-0.22%
1 ene 1994 año
95.649
-0.337
-0.35%
1 ene 1995 año
95.632
-0.017
-0.02%
1 ene 1996 año
95.404
-0.229
-0.24%
1 ene 1997 año
95.369
-0.035
-0.04%
1 ene 1998 año
95.392
+0.023
0.02%
1 ene 1999 año
94.88
-0.511
-0.54%
1 ene 2000 año
93.944
-0.937
-0.99%
1 ene 2001 año
93.857
-0.087
-0.09%
1 ene 2002 año
94.111
+0.254
0.27%
1 ene 2003 año
94.004
-0.108
-0.11%
1 ene 2004 año
94.065
+0.061
0.06%
1 ene 2005 año
93.913
-0.152
-0.16%
1 ene 2006 año
92.972
-0.941
-1.0%
1 ene 2007 año
92.533
-0.439
-0.47%
1 ene 2008 año
92.766
+0.233
0.25%
1 ene 2009 año
92.441
-0.325
-0.35%
1 ene 2010 año
93.06
+0.619
0.67%
1 ene 2011 año
93.835
+0.775
0.83%
1 ene 2012 año
92.321
-1.514
-1.61%
1 ene 2013 año
91.504
-0.816
-0.88%
1 ene 2014 año
91.681
+0.177
0.19%
1 ene 2015 año
91.054
-0.627
-0.68%
Ranking de los países por los datos estadísticos actuales


Comentarios: