29
/es/
es
AIzaSyAYiBZKx7MnpbEhh9jyipgxe19OcubqV5w
April 1, 2024
257294
Switzerland
CHE
true
2
1
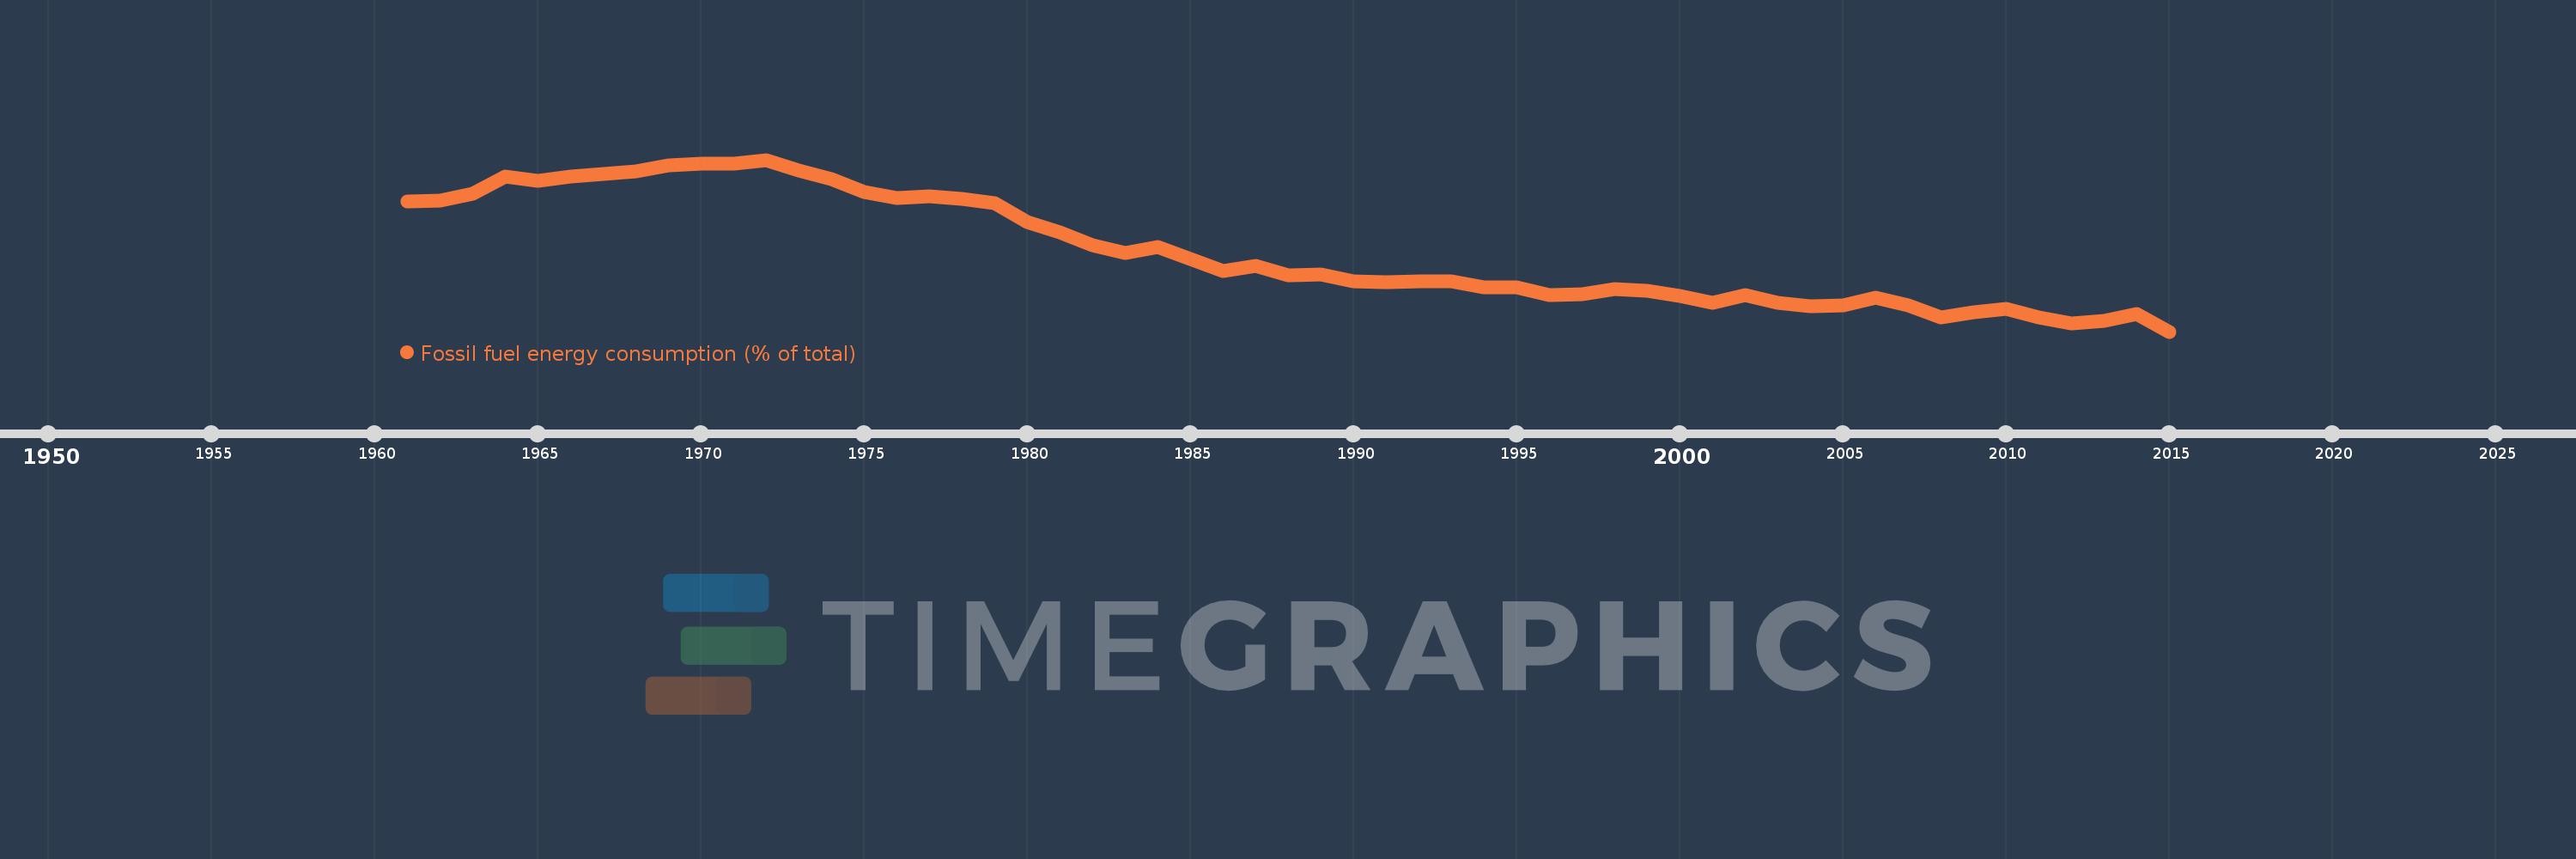
Fossil fuel energy consumption (% of total)
2015,2014,2013,2012,2011,2010,2009,2008,2007,2006,2005,2004,2003,2002,2001,2000,1999,1998,1997,1996,1995,1994,1993,1992,1991,1990,1989,1988,1987,1986,1985,1984,1983,1982,1981,1980,1979,1978,1977,1976,1975,1974,1973,1972,1971,1970,1969,1968,1967,1966,1965,1964,1963,1962,1961
Estas estadísticas en otros países:
AlbaniaAlgeriaAngolaAntigua and BarbudaArab WorldArgentinaArmeniaAustraliaAustriaAzerbaijanBahamas, TheBahrainBangladeshBarbadosBelarusBelgiumBelizeBeninBhutanBoliviaBosnia and HerzegovinaBotswanaBrazilBrunei DarussalamBulgariaCabo VerdeCambodiaCameroonCanadaCaribbean small statesCentral Europe and the BalticsChileChinaColombiaComorosCongo, Dem. Rep.Congo, Rep.Costa RicaCote d'IvoireCroatiaCubaCuracaoCyprusCzech RepublicDenmarkDjiboutiDominicaDominican RepublicEarly-demographic dividendEast Asia & PacificEast Asia & Pacific (excluding high income)East Asia & Pacific (IDA & IBRD countries)EcuadorEgypt, Arab Rep.El SalvadorEquatorial GuineaEritreaEstoniaEthiopiaEuro areaEurope & Central AsiaEurope & Central Asia (excluding high income)Europe & Central Asia (IDA & IBRD countries)European UnionFijiFinlandFragile and conflict affected situationsFranceGabonGambia, TheGeorgiaGermanyGhanaGibraltarGreeceGrenadaGuatemalaGuinea-BissauGuyanaHaitiHeavily indebted poor countries (HIPC)High incomeHondurasHong Kong SAR, ChinaHungaryIBRD onlyIcelandIDA & IBRD totalIDA blendIDA onlyIDA totalIndiaIndonesiaIran, Islamic Rep.IraqIrelandIsraelItalyJamaicaJapanJordanKazakhstanKenyaKiribatiKorea, Dem. People’s Rep.Korea, Rep.KosovoKuwaitKyrgyz RepublicLate-demographic dividendLatin America & Caribbean Latin America & Caribbean (excluding high income)Latin America & the Caribbean (IDA & IBRD countries)LatviaLeast developed countries: UN classificationLebanonLesothoLibyaLithuaniaLow & middle incomeLow incomeLower middle incomeLuxembourgMacedonia, FYRMalaysiaMaldivesMaltaMarshall IslandsMauritiusMexicoMiddle East & North AfricaMiddle East & North Africa (excluding high income)Middle East & North Africa (IDA & IBRD countries)Middle incomeMoldovaMongoliaMontenegroMoroccoMozambiqueMyanmarNamibiaNepalNetherlandsNew ZealandNicaraguaNigerNigeriaNorth AmericaNorwayOECD membersOmanOther small statesPacific island small statesPakistanPalauPanamaParaguayPeruPhilippinesPolandPortugalPost-demographic dividendPre-demographic dividendQatarRomaniaRussian FederationSamoaSao Tome and PrincipeSaudi ArabiaSenegalSerbiaSeychellesSingaporeSlovak RepublicSloveniaSmall statesSolomon IslandsSouth AfricaSouth AsiaSouth Asia (IDA & IBRD)South SudanSpainSri LankaSt. Kitts and NevisSt. LuciaSt. Vincent and the GrenadinesSub-Saharan Africa Sub-Saharan Africa (excluding high income)Sub-Saharan Africa (IDA & IBRD countries)SudanSurinameSwazilandSwedenSwitzerlandSyrian Arab RepublicTajikistanTanzaniaThailandTimor-LesteTogoTongaTrinidad and TobagoTunisiaTurkeyUkraineUnited Arab EmiratesUnited KingdomUnited StatesUpper middle incomeUruguayUzbekistanVanuatuVenezuela, RBVietnamWorldYemen, Rep.ZambiaZimbabwe línea de tiempo (timeline):
En esta escala de tiempo se presenta un gráfico de 1961 y 2015 de Switzerland. Los datos de 1960 están ausentes. El número de observaciones reales por fecha: 55.
Fuente (nombre):
Indicadores del desarrollo mundial
Fuente (organización):
IEA Statistics © OECD/IEA 2014 (http://www.iea.org/stats/index.asp), subject to https://www.iea.org/t&c/termsandconditions/
Categorías:
Energy & Mining
Se ha actualizado:
23 abr 2017 año
Los indicadores de los cambios de valor en los últimos años
Mínimo:
48.701
1 ene 2015 año
Máximo:
82.843
1 ene 1972 año
A la fecha de observación
Valor
Cambio absoluto
El cambio con respecto al valor anterior
1 ene 1961 año
74.572
+74.572
0.0%
1 ene 1962 año
74.784
+0.212
0.28%
1 ene 1963 año
76.018
+1.234
1.65%
1 ene 1964 año
79.563
+3.545
4.66%
1 ene 1965 año
78.694
-0.869
-1.09%
1 ene 1966 año
79.518
+0.823
1.05%
1 ene 1967 año
80.042
+0.524
0.66%
1 ene 1968 año
80.599
+0.557
0.7%
1 ene 1969 año
81.817
+1.218
1.51%
1 ene 1970 año
82.141
+0.324
0.4%
1 ene 1971 año
82.017
-0.124
-0.15%
1 ene 1972 año
82.843
+0.826
1.01%
1 ene 1973 año
80.771
-2.073
-2.5%
1 ene 1974 año
78.928
-1.843
-2.28%
1 ene 1975 año
76.481
-2.447
-3.1%
1 ene 1976 año
75.182
-1.299
-1.7%
1 ene 1977 año
75.617
+0.436
0.58%
1 ene 1978 año
75.031
-0.586
-0.77%
1 ene 1979 año
74.193
-0.838
-1.12%
1 ene 1980 año
70.544
-3.649
-4.92%
1 ene 1981 año
68.401
-2.144
-3.04%
1 ene 1982 año
65.797
-2.604
-3.81%
1 ene 1983 año
64.349
-1.447
-2.2%
1 ene 1984 año
65.6
+1.251
1.94%
1 ene 1985 año
63.102
-2.499
-3.81%
1 ene 1986 año
60.787
-2.315
-3.67%
1 ene 1987 año
61.78
+0.993
1.63%
1 ene 1988 año
59.892
-1.888
-3.06%
1 ene 1989 año
60.109
+0.217
0.36%
1 ene 1990 año
58.759
-1.35
-2.25%
1 ene 1991 año
58.476
-0.283
-0.48%
1 ene 1992 año
58.672
+0.196
0.33%
1 ene 1993 año
58.756
+0.084
0.14%
1 ene 1994 año
57.531
-1.224
-2.08%
1 ene 1995 año
57.523
-0.008
-0.01%
1 ene 1996 año
55.888
-1.635
-2.84%
1 ene 1997 año
56.135
+0.247
0.44%
1 ene 1998 año
57.204
+1.069
1.9%
1 ene 1999 año
56.888
-0.316
-0.55%
1 ene 2000 año
55.811
-1.077
-1.89%
1 ene 2001 año
54.365
-1.446
-2.59%
1 ene 2002 año
56.027
+1.662
3.06%
1 ene 2003 año
54.46
-1.567
-2.8%
1 ene 2004 año
53.785
-0.675
-1.24%
1 ene 2005 año
53.974
+0.189
0.35%
1 ene 2006 año
55.47
+1.495
2.77%
1 ene 2007 año
53.834
-1.636
-2.95%
1 ene 2008 año
51.478
-2.356
-4.38%
1 ene 2009 año
52.493
+1.015
1.97%
1 ene 2010 año
53.224
+0.731
1.39%
1 ene 2011 año
51.544
-1.68
-3.16%
1 ene 2012 año
50.375
-1.169
-2.27%
1 ene 2013 año
50.914
+0.539
1.07%
1 ene 2014 año
52.123
+1.209
2.37%
1 ene 2015 año
48.701
-3.421
-6.56%
Ranking de los países por los datos estadísticos actuales


Comentarios: