29
/es/
es
AIzaSyAYiBZKx7MnpbEhh9jyipgxe19OcubqV5w
April 1, 2024
72961
Australia
AUS
true
2
1
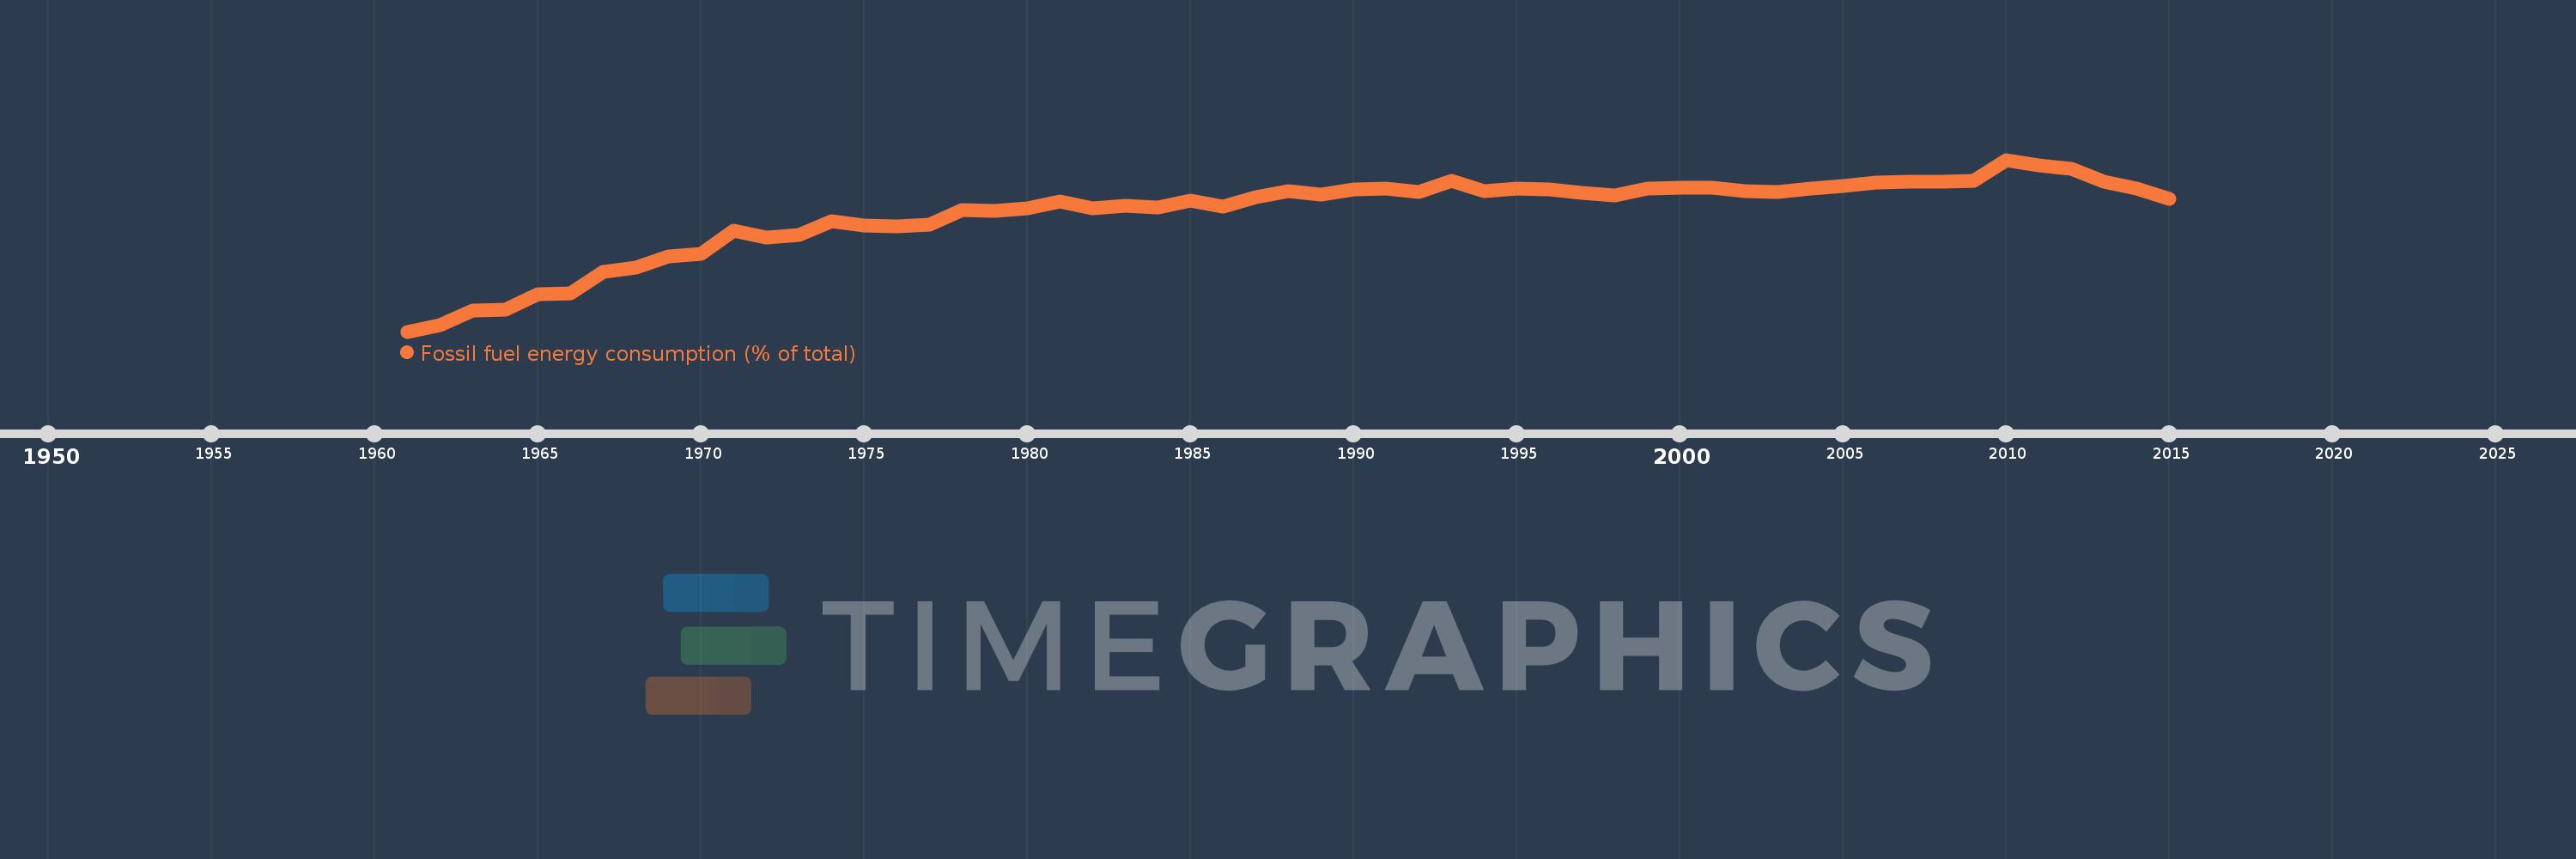
Fossil fuel energy consumption (% of total)
2015,2014,2013,2012,2011,2010,2009,2008,2007,2006,2005,2004,2003,2002,2001,2000,1999,1998,1997,1996,1995,1994,1993,1992,1991,1990,1989,1988,1987,1986,1985,1984,1983,1982,1981,1980,1979,1978,1977,1976,1975,1974,1973,1972,1971,1970,1969,1968,1967,1966,1965,1964,1963,1962,1961
Estas estadísticas en otros países:
AlbaniaAlgeriaAngolaAntigua and BarbudaArab WorldArgentinaArmeniaAustraliaAustriaAzerbaijanBahamas, TheBahrainBangladeshBarbadosBelarusBelgiumBelizeBeninBhutanBoliviaBosnia and HerzegovinaBotswanaBrazilBrunei DarussalamBulgariaCabo VerdeCambodiaCameroonCanadaCaribbean small statesCentral Europe and the BalticsChileChinaColombiaComorosCongo, Dem. Rep.Congo, Rep.Costa RicaCote d'IvoireCroatiaCubaCuracaoCyprusCzech RepublicDenmarkDjiboutiDominicaDominican RepublicEarly-demographic dividendEast Asia & PacificEast Asia & Pacific (excluding high income)East Asia & Pacific (IDA & IBRD countries)EcuadorEgypt, Arab Rep.El SalvadorEquatorial GuineaEritreaEstoniaEthiopiaEuro areaEurope & Central AsiaEurope & Central Asia (excluding high income)Europe & Central Asia (IDA & IBRD countries)European UnionFijiFinlandFragile and conflict affected situationsFranceGabonGambia, TheGeorgiaGermanyGhanaGibraltarGreeceGrenadaGuatemalaGuinea-BissauGuyanaHaitiHeavily indebted poor countries (HIPC)High incomeHondurasHong Kong SAR, ChinaHungaryIBRD onlyIcelandIDA & IBRD totalIDA blendIDA onlyIDA totalIndiaIndonesiaIran, Islamic Rep.IraqIrelandIsraelItalyJamaicaJapanJordanKazakhstanKenyaKiribatiKorea, Dem. People’s Rep.Korea, Rep.KosovoKuwaitKyrgyz RepublicLate-demographic dividendLatin America & Caribbean Latin America & Caribbean (excluding high income)Latin America & the Caribbean (IDA & IBRD countries)LatviaLeast developed countries: UN classificationLebanonLesothoLibyaLithuaniaLow & middle incomeLow incomeLower middle incomeLuxembourgMacedonia, FYRMalaysiaMaldivesMaltaMarshall IslandsMauritiusMexicoMiddle East & North AfricaMiddle East & North Africa (excluding high income)Middle East & North Africa (IDA & IBRD countries)Middle incomeMoldovaMongoliaMontenegroMoroccoMozambiqueMyanmarNamibiaNepalNetherlandsNew ZealandNicaraguaNigerNigeriaNorth AmericaNorwayOECD membersOmanOther small statesPacific island small statesPakistanPalauPanamaParaguayPeruPhilippinesPolandPortugalPost-demographic dividendPre-demographic dividendQatarRomaniaRussian FederationSamoaSao Tome and PrincipeSaudi ArabiaSenegalSerbiaSeychellesSingaporeSlovak RepublicSloveniaSmall statesSolomon IslandsSouth AfricaSouth AsiaSouth Asia (IDA & IBRD)South SudanSpainSri LankaSt. Kitts and NevisSt. LuciaSt. Vincent and the GrenadinesSub-Saharan Africa Sub-Saharan Africa (excluding high income)Sub-Saharan Africa (IDA & IBRD countries)SudanSurinameSwazilandSwedenSwitzerlandSyrian Arab RepublicTajikistanTanzaniaThailandTimor-LesteTogoTongaTrinidad and TobagoTunisiaTurkeyUkraineUnited Arab EmiratesUnited KingdomUnited StatesUpper middle incomeUruguayUzbekistanVanuatuVenezuela, RBVietnamWorldYemen, Rep.ZambiaZimbabwe línea de tiempo (timeline):
En esta escala de tiempo se presenta un gráfico de 1961 y 2015 de Australia. Los datos de 1960 están ausentes. El número de observaciones reales por fecha: 55.
Fuente (nombre):
Indicadores del desarrollo mundial
Fuente (organización):
IEA Statistics © OECD/IEA 2014 (http://www.iea.org/stats/index.asp), subject to https://www.iea.org/t&c/termsandconditions/
Categorías:
Energy & Mining
Se ha actualizado:
23 abr 2017 año
Los indicadores de los cambios de valor en los últimos años
Mínimo:
85.907
1 ene 1961 año
Máximo:
95.51
1 ene 2010 año
A la fecha de observación
Valor
Cambio absoluto
El cambio con respecto al valor anterior
1 ene 1961 año
85.907
+85.907
0.0%
1 ene 1962 año
86.252
+0.345
0.4%
1 ene 1963 año
87.07
+0.818
0.95%
1 ene 1964 año
87.128
+0.058
0.07%
1 ene 1965 año
87.976
+0.848
0.97%
1 ene 1966 año
88.042
+0.066
0.08%
1 ene 1967 año
89.242
+1.2
1.36%
1 ene 1968 año
89.501
+0.259
0.29%
1 ene 1969 año
90.105
+0.604
0.67%
1 ene 1970 año
90.27
+0.165
0.18%
1 ene 1971 año
91.531
+1.261
1.4%
1 ene 1972 año
91.178
-0.353
-0.39%
1 ene 1973 año
91.306
+0.128
0.14%
1 ene 1974 año
92.098
+0.792
0.87%
1 ene 1975 año
91.827
-0.271
-0.29%
1 ene 1976 año
91.781
-0.046
-0.05%
1 ene 1977 año
91.888
+0.107
0.12%
1 ene 1978 año
92.679
+0.791
0.86%
1 ene 1979 año
92.655
-0.024
-0.03%
1 ene 1980 año
92.821
+0.166
0.18%
1 ene 1981 año
93.183
+0.362
0.39%
1 ene 1982 año
92.776
-0.407
-0.44%
1 ene 1983 año
92.925
+0.15
0.16%
1 ene 1984 año
92.849
-0.076
-0.08%
1 ene 1985 año
93.207
+0.357
0.38%
1 ene 1986 año
92.879
-0.328
-0.35%
1 ene 1987 año
93.422
+0.543
0.58%
1 ene 1988 año
93.739
+0.317
0.34%
1 ene 1989 año
93.578
-0.16
-0.17%
1 ene 1990 año
93.852
+0.274
0.29%
1 ene 1991 año
93.911
+0.059
0.06%
1 ene 1992 año
93.689
-0.223
-0.24%
1 ene 1993 año
94.343
+0.654
0.7%
1 ene 1994 año
93.758
-0.584
-0.62%
1 ene 1995 año
93.886
+0.128
0.14%
1 ene 1996 año
93.832
-0.055
-0.06%
1 ene 1997 año
93.648
-0.184
-0.2%
1 ene 1998 año
93.513
-0.136
-0.14%
1 ene 1999 año
93.879
+0.366
0.39%
1 ene 2000 año
93.928
+0.049
0.05%
1 ene 2001 año
93.958
+0.03
0.03%
1 ene 2002 año
93.741
-0.217
-0.23%
1 ene 2003 año
93.693
-0.048
-0.05%
1 ene 2004 año
93.886
+0.193
0.21%
1 ene 2005 año
94.068
+0.182
0.19%
1 ene 2006 año
94.216
+0.148
0.16%
1 ene 2007 año
94.281
+0.065
0.07%
1 ene 2008 año
94.293
+0.012
0.01%
1 ene 2009 año
94.347
+0.054
0.06%
1 ene 2010 año
95.51
+1.163
1.23%
1 ene 2011 año
95.206
-0.304
-0.32%
1 ene 2012 año
94.996
-0.211
-0.22%
1 ene 2013 año
94.296
-0.7
-0.74%
1 ene 2014 año
93.896
-0.4
-0.42%
1 ene 2015 año
93.322
-0.574
-0.61%
Ranking de los países por los datos estadísticos actuales


Comentarios: