29
/es/
es
AIzaSyAYiBZKx7MnpbEhh9jyipgxe19OcubqV5w
April 1, 2024
46097
Low income
LIC
false
2
1
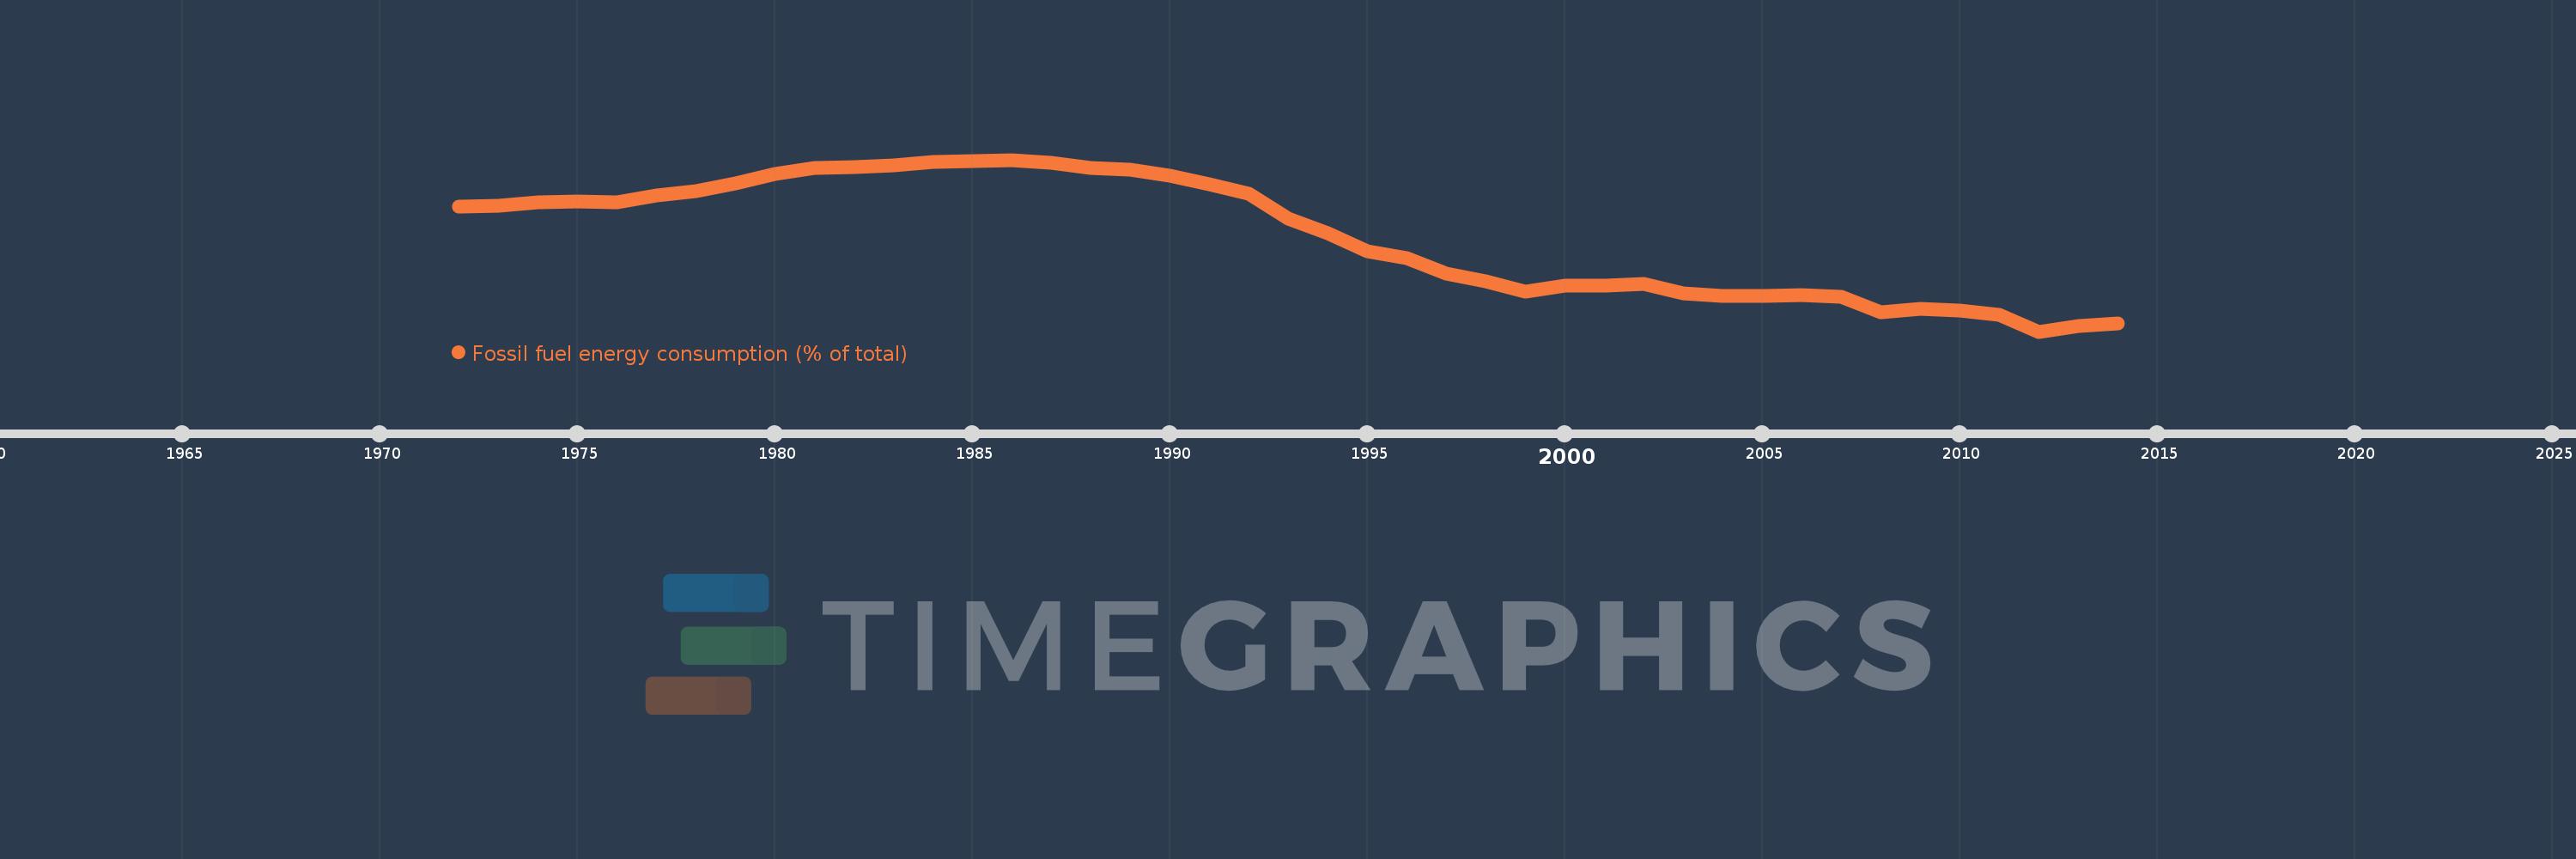
Fossil fuel energy consumption (% of total)
2014,2013,2012,2011,2010,2009,2008,2007,2006,2005,2004,2003,2002,2001,2000,1999,1998,1997,1996,1995,1994,1993,1992,1991,1990,1989,1988,1987,1986,1985,1984,1983,1982,1981,1980,1979,1978,1977,1976,1975,1974,1973,1972
Estas estadísticas en otros países:
AlbaniaAlgeriaAngolaAntigua and BarbudaArab WorldArgentinaArmeniaAustraliaAustriaAzerbaijanBahamas, TheBahrainBangladeshBarbadosBelarusBelgiumBelizeBeninBhutanBoliviaBosnia and HerzegovinaBotswanaBrazilBrunei DarussalamBulgariaCabo VerdeCambodiaCameroonCanadaCaribbean small statesCentral Europe and the BalticsChileChinaColombiaComorosCongo, Dem. Rep.Congo, Rep.Costa RicaCote d'IvoireCroatiaCubaCuracaoCyprusCzech RepublicDenmarkDjiboutiDominicaDominican RepublicEarly-demographic dividendEast Asia & PacificEast Asia & Pacific (excluding high income)East Asia & Pacific (IDA & IBRD countries)EcuadorEgypt, Arab Rep.El SalvadorEquatorial GuineaEritreaEstoniaEthiopiaEuro areaEurope & Central AsiaEurope & Central Asia (excluding high income)Europe & Central Asia (IDA & IBRD countries)European UnionFijiFinlandFragile and conflict affected situationsFranceGabonGambia, TheGeorgiaGermanyGhanaGibraltarGreeceGrenadaGuatemalaGuinea-BissauGuyanaHaitiHeavily indebted poor countries (HIPC)High incomeHondurasHong Kong SAR, ChinaHungaryIBRD onlyIcelandIDA & IBRD totalIDA blendIDA onlyIDA totalIndiaIndonesiaIran, Islamic Rep.IraqIrelandIsraelItalyJamaicaJapanJordanKazakhstanKenyaKiribatiKorea, Dem. People’s Rep.Korea, Rep.KosovoKuwaitKyrgyz RepublicLate-demographic dividendLatin America & Caribbean Latin America & Caribbean (excluding high income)Latin America & the Caribbean (IDA & IBRD countries)LatviaLeast developed countries: UN classificationLebanonLesothoLibyaLithuaniaLow & middle incomeLow incomeLower middle incomeLuxembourgMacedonia, FYRMalaysiaMaldivesMaltaMarshall IslandsMauritiusMexicoMiddle East & North AfricaMiddle East & North Africa (excluding high income)Middle East & North Africa (IDA & IBRD countries)Middle incomeMoldovaMongoliaMontenegroMoroccoMozambiqueMyanmarNamibiaNepalNetherlandsNew ZealandNicaraguaNigerNigeriaNorth AmericaNorwayOECD membersOmanOther small statesPacific island small statesPakistanPalauPanamaParaguayPeruPhilippinesPolandPortugalPost-demographic dividendPre-demographic dividendQatarRomaniaRussian FederationSamoaSao Tome and PrincipeSaudi ArabiaSenegalSerbiaSeychellesSingaporeSlovak RepublicSloveniaSmall statesSolomon IslandsSouth AfricaSouth AsiaSouth Asia (IDA & IBRD)South SudanSpainSri LankaSt. Kitts and NevisSt. LuciaSt. Vincent and the GrenadinesSub-Saharan Africa Sub-Saharan Africa (excluding high income)Sub-Saharan Africa (IDA & IBRD countries)SudanSurinameSwazilandSwedenSwitzerlandSyrian Arab RepublicTajikistanTanzaniaThailandTimor-LesteTogoTongaTrinidad and TobagoTunisiaTurkeyUkraineUnited Arab EmiratesUnited KingdomUnited StatesUpper middle incomeUruguayUzbekistanVanuatuVenezuela, RBVietnamWorldYemen, Rep.ZambiaZimbabwe línea de tiempo (timeline):
En esta escala de tiempo se presenta un gráfico de 1972 y 2014 de Low income. Los datos de 1971 están ausentes. El número de observaciones reales por fecha: 43.
Fuente (nombre):
Indicadores del desarrollo mundial
Fuente (organización):
IEA Statistics © OECD/IEA 2014 (http://www.iea.org/stats/index.asp), subject to https://www.iea.org/t&c/termsandconditions/
Categorías:
Energy & Mining
Se ha actualizado:
23 abr 2017 año
Los indicadores de los cambios de valor en los últimos años
Mínimo:
19.02
1 ene 2012 año
Máximo:
41.814
1 ene 1986 año
A la fecha de observación
Valor
Cambio absoluto
El cambio con respecto al valor anterior
1 ene 1972 año
35.6
+35.6
0.0%
1 ene 1973 año
35.714
+0.114
0.32%
1 ene 1974 año
36.187
+0.473
1.32%
1 ene 1975 año
36.264
+0.077
0.21%
1 ene 1976 año
36.213
-0.051
-0.14%
1 ene 1977 año
37.069
+0.856
2.36%
1 ene 1978 año
37.704
+0.635
1.71%
1 ene 1979 año
38.664
+0.959
2.54%
1 ene 1980 año
39.879
+1.215
3.14%
1 ene 1981 año
40.757
+0.878
2.2%
1 ene 1982 año
40.889
+0.132
0.32%
1 ene 1983 año
41.105
+0.216
0.53%
1 ene 1984 año
41.572
+0.468
1.14%
1 ene 1985 año
41.698
+0.125
0.3%
1 ene 1986 año
41.814
+0.117
0.28%
1 ene 1987 año
41.428
-0.387
-0.93%
1 ene 1988 año
40.779
-0.649
-1.57%
1 ene 1989 año
40.473
-0.306
-0.75%
1 ene 1990 año
39.691
-0.781
-1.93%
1 ene 1991 año
38.607
-1.084
-2.73%
1 ene 1992 año
37.339
-1.268
-3.28%
1 ene 1993 año
34.039
-3.3
-8.84%
1 ene 1994 año
32.049
-1.99
-5.85%
1 ene 1995 año
29.622
-2.427
-7.57%
1 ene 1996 año
28.803
-0.819
-2.76%
1 ene 1997 año
26.724
-2.079
-7.22%
1 ene 1998 año
25.711
-1.013
-3.79%
1 ene 1999 año
24.263
-1.449
-5.63%
1 ene 2000 año
25.144
+0.882
3.63%
1 ene 2001 año
25.096
-0.048
-0.19%
1 ene 2002 año
25.299
+0.203
0.81%
1 ene 2003 año
24.082
-1.218
-4.81%
1 ene 2004 año
23.725
-0.356
-1.48%
1 ene 2005 año
23.804
+0.079
0.33%
1 ene 2006 año
23.918
+0.114
0.48%
1 ene 2007 año
23.646
-0.272
-1.14%
1 ene 2008 año
21.594
-2.052
-8.68%
1 ene 2009 año
22.089
+0.494
2.29%
1 ene 2010 año
21.825
-0.264
-1.19%
1 ene 2011 año
21.251
-0.574
-2.63%
1 ene 2012 año
19.02
-2.232
-10.5%
1 ene 2013 año
19.724
+0.704
3.7%
1 ene 2014 año
20.09
+0.367
1.86%
Ranking de los países por los datos estadísticos actuales


Comentarios: