29
/es/
es
AIzaSyAYiBZKx7MnpbEhh9jyipgxe19OcubqV5w
April 1, 2024
228470
Romania
ROU
true
2
1
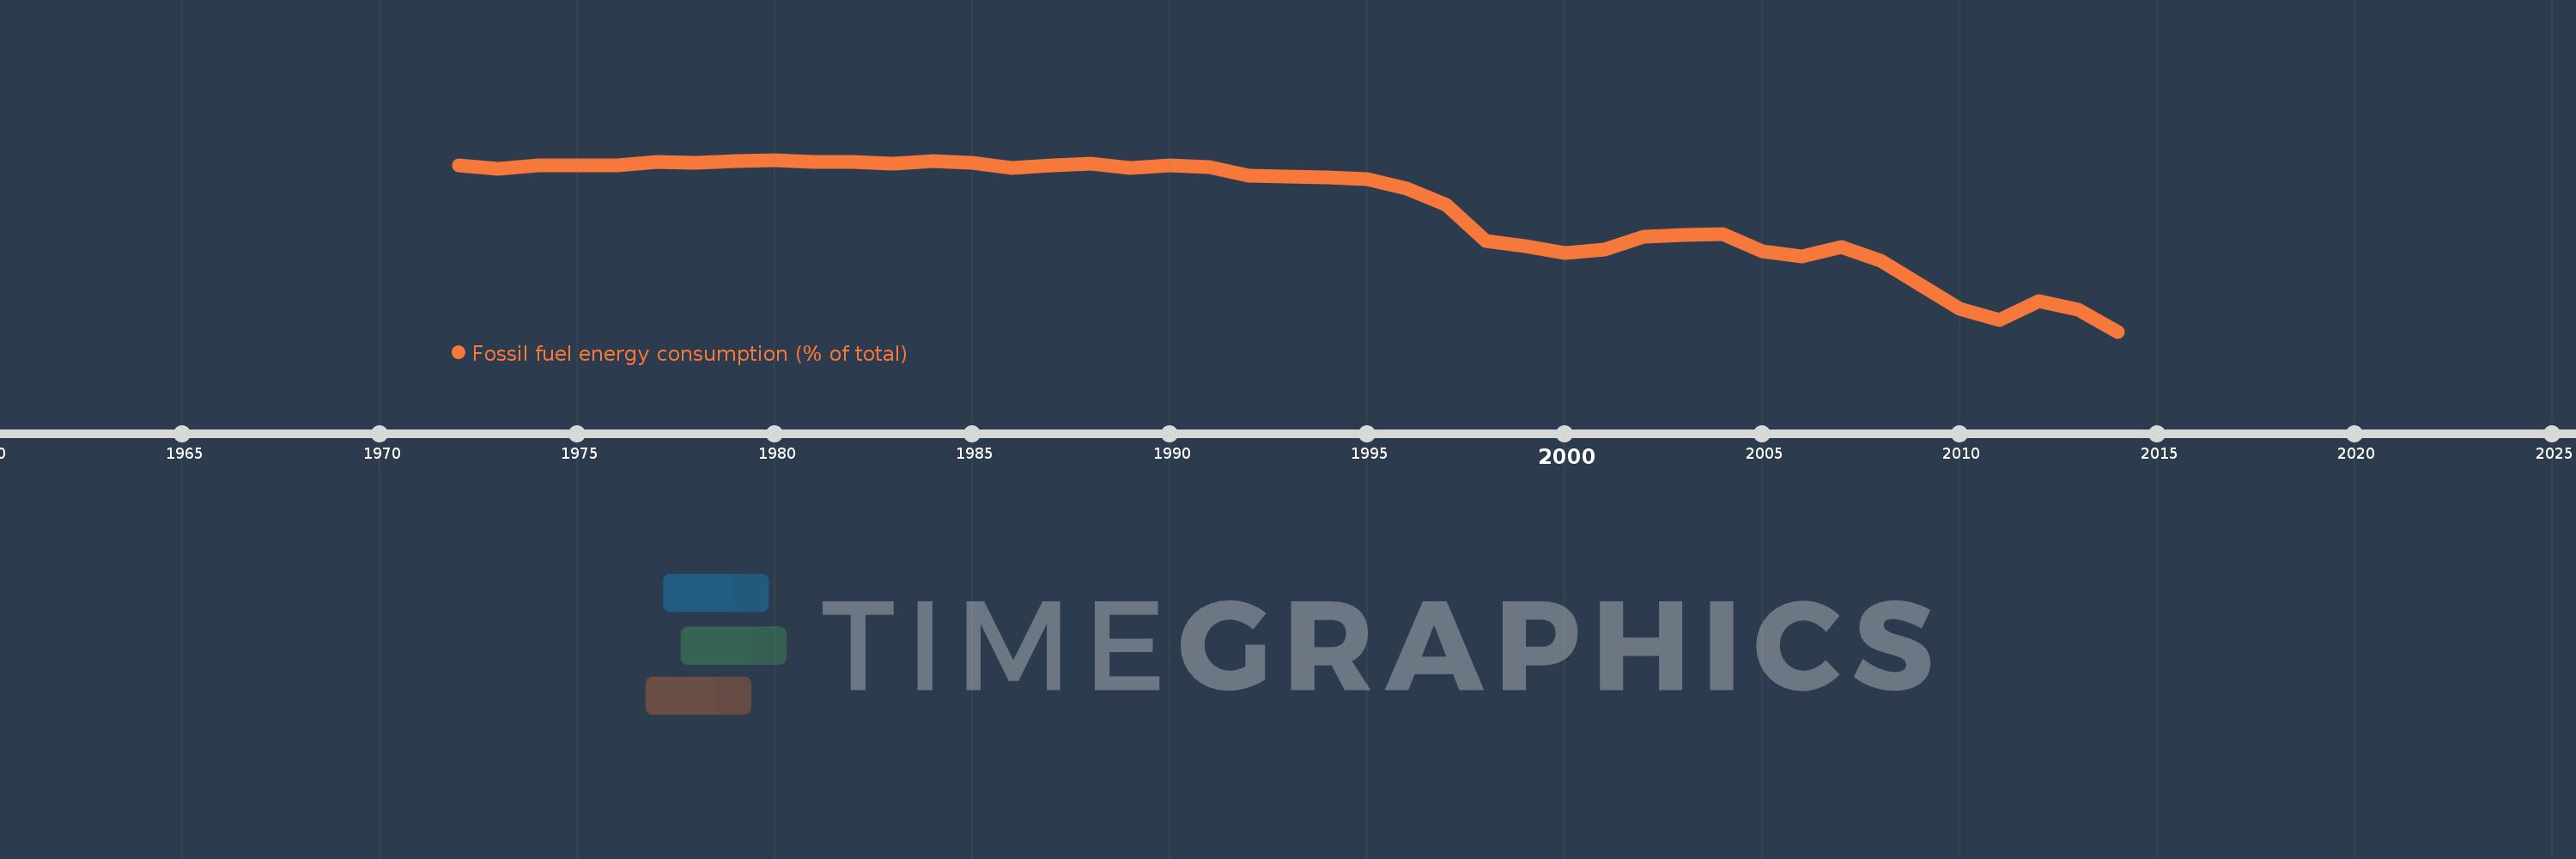
Fossil fuel energy consumption (% of total)
2014,2013,2012,2011,2010,2009,2008,2007,2006,2005,2004,2003,2002,2001,2000,1999,1998,1997,1996,1995,1994,1993,1992,1991,1990,1989,1988,1987,1986,1985,1984,1983,1982,1981,1980,1979,1978,1977,1976,1975,1974,1973,1972
Estas estadísticas en otros países:
AlbaniaAlgeriaAngolaAntigua and BarbudaArab WorldArgentinaArmeniaAustraliaAustriaAzerbaijanBahamas, TheBahrainBangladeshBarbadosBelarusBelgiumBelizeBeninBhutanBoliviaBosnia and HerzegovinaBotswanaBrazilBrunei DarussalamBulgariaCabo VerdeCambodiaCameroonCanadaCaribbean small statesCentral Europe and the BalticsChileChinaColombiaComorosCongo, Dem. Rep.Congo, Rep.Costa RicaCote d'IvoireCroatiaCubaCuracaoCyprusCzech RepublicDenmarkDjiboutiDominicaDominican RepublicEarly-demographic dividendEast Asia & PacificEast Asia & Pacific (excluding high income)East Asia & Pacific (IDA & IBRD countries)EcuadorEgypt, Arab Rep.El SalvadorEquatorial GuineaEritreaEstoniaEthiopiaEuro areaEurope & Central AsiaEurope & Central Asia (excluding high income)Europe & Central Asia (IDA & IBRD countries)European UnionFijiFinlandFragile and conflict affected situationsFranceGabonGambia, TheGeorgiaGermanyGhanaGibraltarGreeceGrenadaGuatemalaGuinea-BissauGuyanaHaitiHeavily indebted poor countries (HIPC)High incomeHondurasHong Kong SAR, ChinaHungaryIBRD onlyIcelandIDA & IBRD totalIDA blendIDA onlyIDA totalIndiaIndonesiaIran, Islamic Rep.IraqIrelandIsraelItalyJamaicaJapanJordanKazakhstanKenyaKiribatiKorea, Dem. People’s Rep.Korea, Rep.KosovoKuwaitKyrgyz RepublicLate-demographic dividendLatin America & Caribbean Latin America & Caribbean (excluding high income)Latin America & the Caribbean (IDA & IBRD countries)LatviaLeast developed countries: UN classificationLebanonLesothoLibyaLithuaniaLow & middle incomeLow incomeLower middle incomeLuxembourgMacedonia, FYRMalaysiaMaldivesMaltaMarshall IslandsMauritiusMexicoMiddle East & North AfricaMiddle East & North Africa (excluding high income)Middle East & North Africa (IDA & IBRD countries)Middle incomeMoldovaMongoliaMontenegroMoroccoMozambiqueMyanmarNamibiaNepalNetherlandsNew ZealandNicaraguaNigerNigeriaNorth AmericaNorwayOECD membersOmanOther small statesPacific island small statesPakistanPalauPanamaParaguayPeruPhilippinesPolandPortugalPost-demographic dividendPre-demographic dividendQatarRomaniaRussian FederationSamoaSao Tome and PrincipeSaudi ArabiaSenegalSerbiaSeychellesSingaporeSlovak RepublicSloveniaSmall statesSolomon IslandsSouth AfricaSouth AsiaSouth Asia (IDA & IBRD)South SudanSpainSri LankaSt. Kitts and NevisSt. LuciaSt. Vincent and the GrenadinesSub-Saharan Africa Sub-Saharan Africa (excluding high income)Sub-Saharan Africa (IDA & IBRD countries)SudanSurinameSwazilandSwedenSwitzerlandSyrian Arab RepublicTajikistanTanzaniaThailandTimor-LesteTogoTongaTrinidad and TobagoTunisiaTurkeyUkraineUnited Arab EmiratesUnited KingdomUnited StatesUpper middle incomeUruguayUzbekistanVanuatuVenezuela, RBVietnamWorldYemen, Rep.ZambiaZimbabwe línea de tiempo (timeline):
En esta escala de tiempo se presenta un gráfico de 1972 y 2014 de Romania. Los datos de 1971 están ausentes. El número de observaciones reales por fecha: 43.
Fuente (nombre):
Indicadores del desarrollo mundial
Fuente (organización):
IEA Statistics © OECD/IEA 2014 (http://www.iea.org/stats/index.asp), subject to https://www.iea.org/t&c/termsandconditions/
Categorías:
Energy & Mining
Se ha actualizado:
23 abr 2017 año
Los indicadores de los cambios de valor en los últimos años
Mínimo:
73.43
1 ene 2014 año
Máximo:
97.162
1 ene 1980 año
A la fecha de observación
Valor
Cambio absoluto
El cambio con respecto al valor anterior
1 ene 1972 año
96.435
+96.435
0.0%
1 ene 1973 año
95.879
-0.556
-0.58%
1 ene 1974 año
96.42
+0.54
0.56%
1 ene 1975 año
96.343
-0.076
-0.08%
1 ene 1976 año
96.432
+0.089
0.09%
1 ene 1977 año
96.878
+0.445
0.46%
1 ene 1978 año
96.719
-0.159
-0.16%
1 ene 1979 año
96.948
+0.229
0.24%
1 ene 1980 año
97.162
+0.214
0.22%
1 ene 1981 año
96.813
-0.349
-0.36%
1 ene 1982 año
96.906
+0.093
0.1%
1 ene 1983 año
96.687
-0.219
-0.23%
1 ene 1984 año
96.959
+0.272
0.28%
1 ene 1985 año
96.74
-0.22
-0.23%
1 ene 1986 año
96.048
-0.692
-0.72%
1 ene 1987 año
96.414
+0.366
0.38%
1 ene 1988 año
96.604
+0.19
0.2%
1 ene 1989 año
96.018
-0.586
-0.61%
1 ene 1990 año
96.388
+0.37
0.39%
1 ene 1991 año
96.148
-0.24
-0.25%
1 ene 1992 año
94.983
-1.165
-1.21%
1 ene 1993 año
94.82
-0.163
-0.17%
1 ene 1994 año
94.693
-0.127
-0.13%
1 ene 1995 año
94.488
-0.205
-0.22%
1 ene 1996 año
93.158
-1.33
-1.41%
1 ene 1997 año
90.954
-2.203
-2.37%
1 ene 1998 año
85.932
-5.023
-5.52%
1 ene 1999 año
85.231
-0.701
-0.82%
1 ene 2000 año
84.33
-0.901
-1.06%
1 ene 2001 año
84.817
+0.487
0.58%
1 ene 2002 año
86.535
+1.719
2.03%
1 ene 2003 año
86.745
+0.209
0.24%
1 ene 2004 año
86.863
+0.118
0.14%
1 ene 2005 año
84.48
-2.383
-2.74%
1 ene 2006 año
83.867
-0.613
-0.73%
1 ene 2007 año
85.059
+1.192
1.42%
1 ene 2008 año
83.179
-1.879
-2.21%
1 ene 2009 año
79.843
-3.336
-4.01%
1 ene 2010 año
76.595
-3.248
-4.07%
1 ene 2011 año
75.071
-1.524
-1.99%
1 ene 2012 año
77.652
+2.581
3.44%
1 ene 2013 año
76.427
-1.225
-1.58%
1 ene 2014 año
73.43
-2.998
-3.92%
Ranking de los países por los datos estadísticos actuales


Comentarios: