29
/es/
es
AIzaSyAYiBZKx7MnpbEhh9jyipgxe19OcubqV5w
April 1, 2024
92778
Brunei Darussalam
BRN
true
2
1
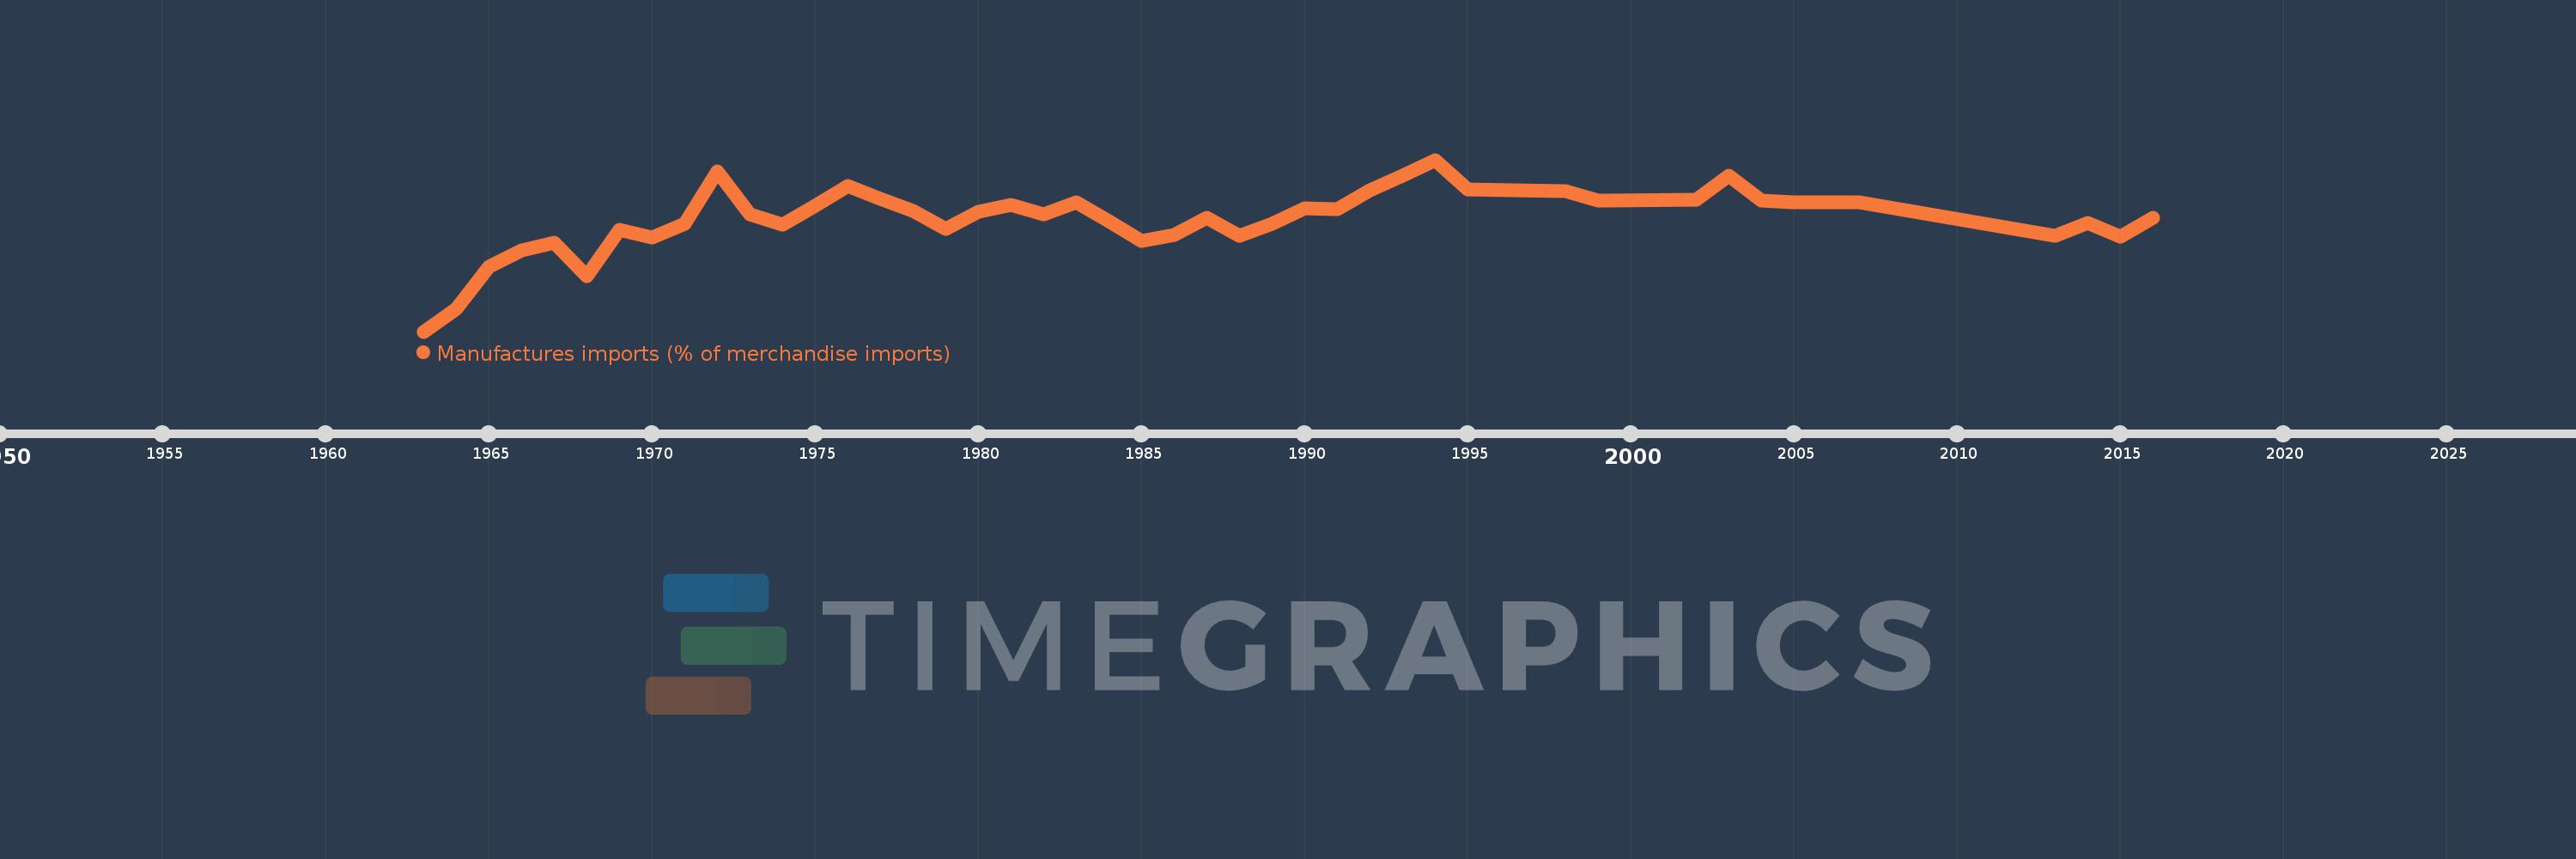
Manufactures imports (% of merchandise imports)
2016,2015,2014,2013,2007,2005,2004,2003,2002,1999,1998,1995,1994,1993,1992,1991,1990,1989,1988,1987,1986,1985,1984,1983,1982,1981,1980,1979,1978,1977,1976,1975,1974,1973,1972,1971,1970,1969,1968,1967,1966,1965,1964,1963
Estas estadísticas en otros países:
AfghanistanAlbaniaAlgeriaAndorraAngolaAntigua and BarbudaArab WorldArgentinaArmeniaArubaAustraliaAustriaAzerbaijanBahamas, TheBahrainBangladeshBarbadosBelarusBelgiumBelizeBeninBermudaBhutanBoliviaBosnia and HerzegovinaBotswanaBrazilBrunei DarussalamBulgariaBurkina FasoBurundiCabo VerdeCambodiaCameroonCanadaCaribbean small statesCayman IslandsCentral African RepublicCentral Europe and the BalticsChadChileChinaColombiaComorosCongo, Dem. Rep.Congo, Rep.Costa RicaCote d'IvoireCroatiaCubaCyprusCzech RepublicDenmarkDjiboutiDominicaDominican RepublicEarly-demographic dividendEast Asia & PacificEast Asia & Pacific (excluding high income)East Asia & Pacific (IDA & IBRD countries)EcuadorEgypt, Arab Rep.El SalvadorEquatorial GuineaEritreaEstoniaEthiopiaEuro areaEurope & Central AsiaEurope & Central Asia (excluding high income)Europe & Central Asia (IDA & IBRD countries)European UnionFaroe IslandsFijiFinlandFragile and conflict affected situationsFranceFrench PolynesiaGabonGambia, TheGeorgiaGermanyGhanaGreeceGreenlandGrenadaGuatemalaGuineaGuinea-BissauGuyanaHaitiHeavily indebted poor countries (HIPC)High incomeHondurasHong Kong SAR, ChinaHungaryIBRD onlyIcelandIDA & IBRD totalIDA blendIDA onlyIDA totalIndiaIndonesiaIran, Islamic Rep.IraqIrelandIsraelItalyJamaicaJapanJordanKazakhstanKenyaKiribatiKorea, Rep.KuwaitKyrgyz RepublicLao PDRLate-demographic dividendLatin America & Caribbean Latin America & Caribbean (excluding high income)Latin America & the Caribbean (IDA & IBRD countries)LatviaLeast developed countries: UN classificationLebanonLesothoLiberiaLibyaLithuaniaLow & middle incomeLow incomeLower middle incomeLuxembourgMacao SAR, ChinaMacedonia, FYRMadagascarMalawiMalaysiaMaldivesMaliMaltaMauritaniaMauritiusMexicoMiddle East & North AfricaMiddle East & North Africa (excluding high income)Middle East & North Africa (IDA & IBRD countries)Middle incomeMoldovaMongoliaMoroccoMozambiqueMyanmarNamibiaNepalNetherlandsNew CaledoniaNew ZealandNicaraguaNigerNigeriaNorth AmericaNorwayOECD membersOmanOther small statesPacific island small statesPakistanPalauPanamaPapua New GuineaParaguayPeruPhilippinesPolandPortugalPost-demographic dividendPre-demographic dividendQatarRomaniaRussian FederationRwandaSamoaSao Tome and PrincipeSaudi ArabiaSenegalSerbiaSeychellesSierra LeoneSingaporeSlovak RepublicSloveniaSmall statesSolomon IslandsSomaliaSouth AfricaSouth AsiaSouth Asia (IDA & IBRD)SpainSri LankaSt. Kitts and NevisSt. LuciaSt. Vincent and the GrenadinesSub-Saharan Africa Sub-Saharan Africa (excluding high income)Sub-Saharan Africa (IDA & IBRD countries)SudanSurinameSwazilandSwedenSwitzerlandSyrian Arab RepublicTajikistanTanzaniaThailandTimor-LesteTogoTongaTrinidad and TobagoTunisiaTurkeyTurkmenistanTurks and Caicos IslandsTuvaluUgandaUkraineUnited Arab EmiratesUnited KingdomUnited StatesUpper middle incomeUruguayVanuatuVenezuela, RBVietnamVirgin Islands (U.S.)WorldYemen, Rep.ZambiaZimbabwe línea de tiempo (timeline):
En esta escala de tiempo se presenta un gráfico de 1963 y 2016 de Brunei Darussalam. Los datos de 1962 están ausentes. El número de observaciones reales por fecha: 44.
Fuente (nombre):
Indicadores del desarrollo mundial
Fuente (organización):
World Bank staff estimates from the Comtrade database maintained by the United Nations Statistics Division.
Categorías:
Private Sector, Trade
Se ha actualizado:
23 abr 2017 año
Los indicadores de los cambios de valor en los últimos años
Mínimo:
53.541
1 ene 1963 año
Máximo:
87.786
1 ene 1994 año
A la fecha de observación
Valor
Cambio absoluto
El cambio con respecto al valor anterior
1 ene 1963 año
53.541
+53.541
0.0%
1 ene 1964 año
58.126
+4.585
8.56%
1 ene 1965 año
66.527
+8.4
14.45%
1 ene 1966 año
69.748
+3.221
4.84%
1 ene 1967 año
71.304
+1.556
2.23%
1 ene 1968 año
64.616
-6.688
-9.38%
1 ene 1969 año
73.87
+9.254
14.32%
1 ene 1970 año
72.264
-1.607
-2.17%
1 ene 1971 año
74.948
+2.684
3.71%
1 ene 1972 año
85.434
+10.487
13.99%
1 ene 1973 año
76.872
-8.563
-10.02%
1 ene 1974 año
74.841
-2.031
-2.64%
1 ene 1975 año
78.63
+3.789
5.06%
1 ene 1976 año
82.499
+3.869
4.92%
1 ene 1977 año
79.938
-2.561
-3.1%
1 ene 1978 año
77.521
-2.416
-3.02%
1 ene 1979 año
74.063
-3.459
-4.46%
1 ene 1980 año
77.472
+3.409
4.6%
1 ene 1981 año
78.766
+1.295
1.67%
1 ene 1982 año
76.904
-1.863
-2.36%
1 ene 1983 año
79.389
+2.485
3.23%
1 ene 1984 año
75.594
-3.794
-4.78%
1 ene 1985 año
71.573
-4.022
-5.32%
1 ene 1986 año
72.831
+1.258
1.76%
1 ene 1987 año
76.146
+3.315
4.55%
1 ene 1988 año
72.576
-3.57
-4.69%
1 ene 1989 año
74.998
+2.422
3.34%
1 ene 1990 año
78.187
+3.189
4.25%
1 ene 1991 año
77.909
-0.278
-0.36%
1 ene 1992 año
81.762
+3.853
4.95%
1 ene 1993 año
84.575
+2.813
3.44%
1 ene 1994 año
87.786
+3.21
3.8%
1 ene 1995 año
81.952
-5.834
-6.65%
1 ene 1998 año
81.564
-0.388
-0.47%
1 ene 1999 año
79.633
-1.931
-2.37%
1 ene 2002 año
79.887
+0.254
0.32%
1 ene 2003 año
84.588
+4.701
5.88%
1 ene 2004 año
79.571
-5.017
-5.93%
1 ene 2005 año
79.329
-0.242
-0.3%
1 ene 2007 año
79.323
-0.006
-0.01%
1 ene 2013 año
72.583
-6.741
-8.5%
1 ene 2014 año
75.148
+2.565
3.53%
1 ene 2015 año
72.514
-2.634
-3.51%
1 ene 2016 año
76.148
+3.634
5.01%
Ranking de los países por los datos estadísticos actuales


Comentarios: