29
/es/
es
AIzaSyAYiBZKx7MnpbEhh9jyipgxe19OcubqV5w
April 1, 2024
276873
United States
USA
true
2
1
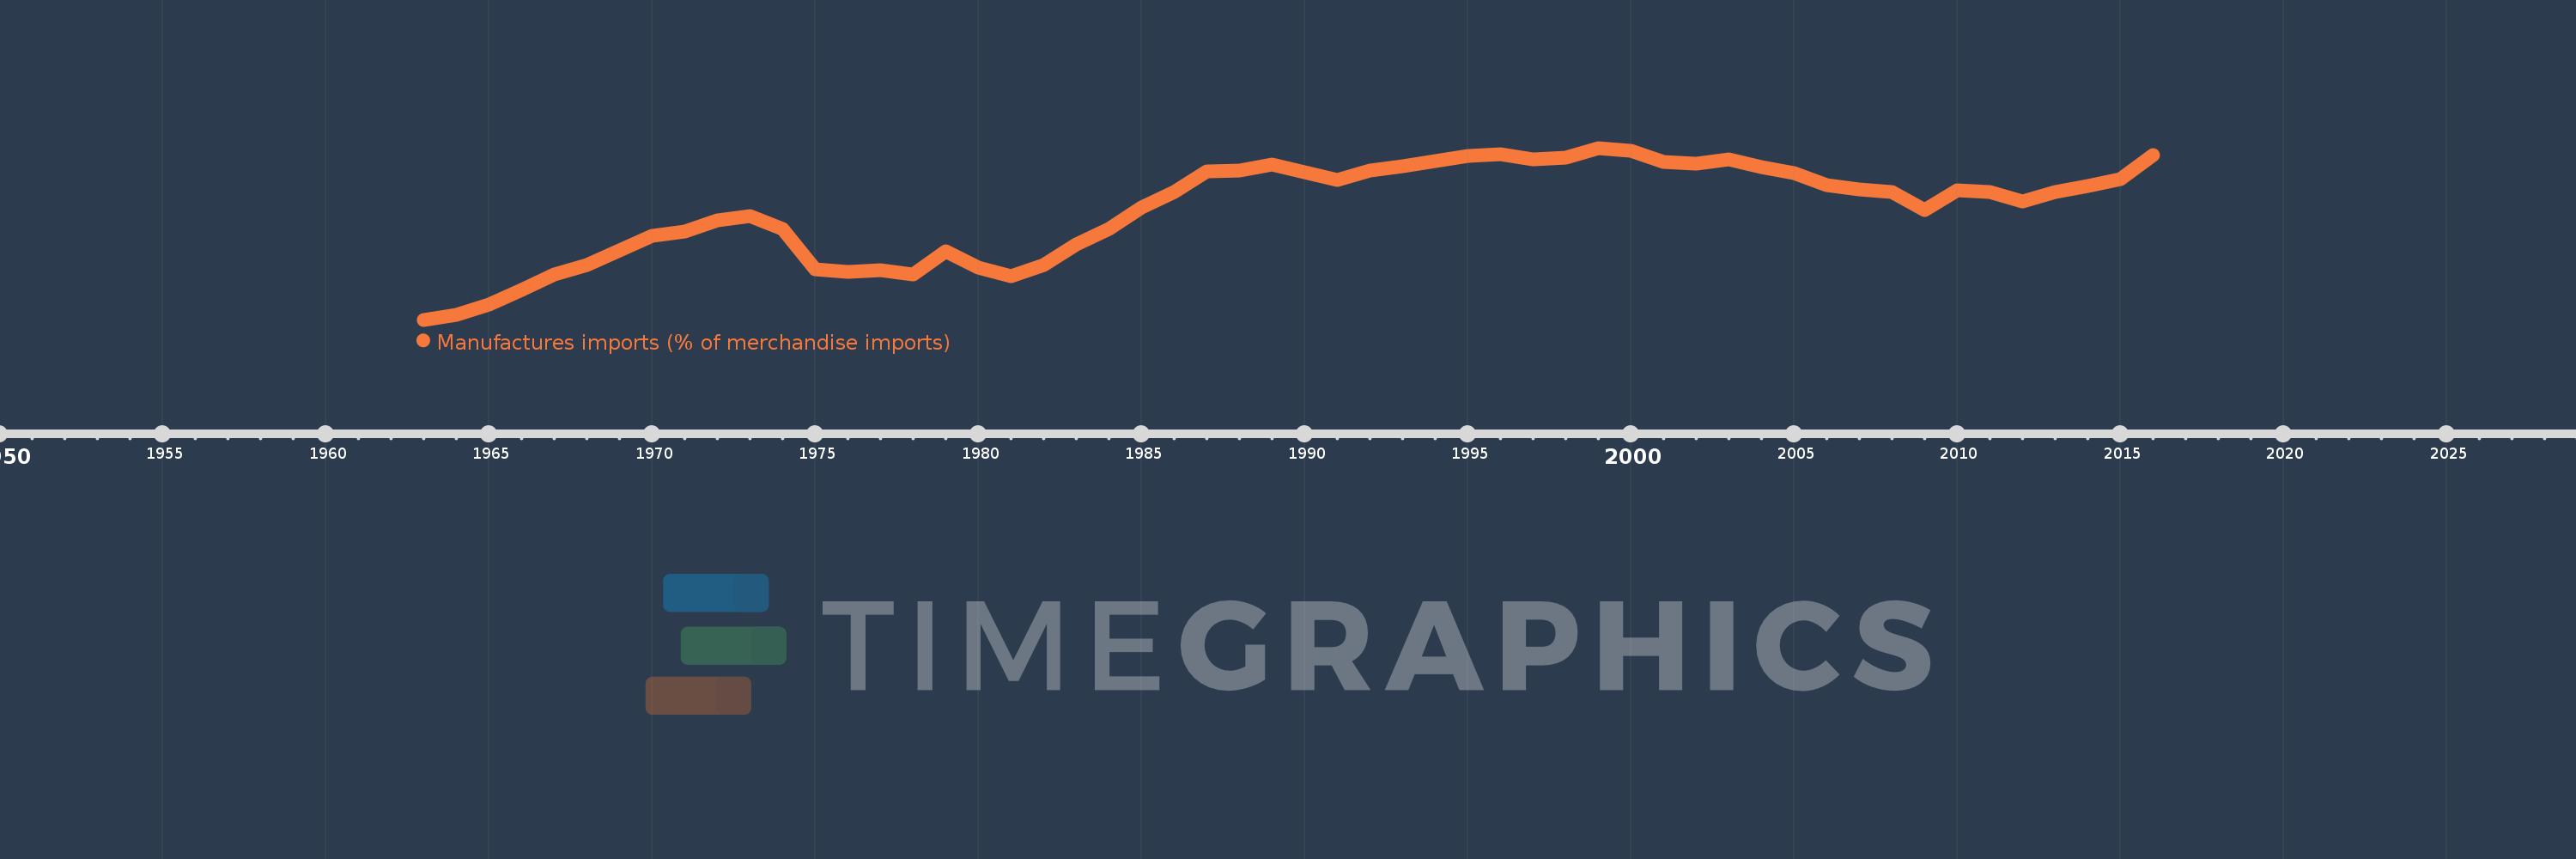
Manufactures imports (% of merchandise imports)
2016,2015,2014,2013,2012,2011,2010,2009,2008,2007,2006,2005,2004,2003,2002,2001,2000,1999,1998,1997,1996,1995,1994,1993,1992,1991,1990,1989,1988,1987,1986,1985,1984,1983,1982,1981,1980,1979,1978,1977,1976,1975,1974,1973,1972,1971,1970,1969,1968,1967,1966,1965,1964,1963
Estas estadísticas en otros países:
AfghanistanAlbaniaAlgeriaAndorraAngolaAntigua and BarbudaArab WorldArgentinaArmeniaArubaAustraliaAustriaAzerbaijanBahamas, TheBahrainBangladeshBarbadosBelarusBelgiumBelizeBeninBermudaBhutanBoliviaBosnia and HerzegovinaBotswanaBrazilBrunei DarussalamBulgariaBurkina FasoBurundiCabo VerdeCambodiaCameroonCanadaCaribbean small statesCayman IslandsCentral African RepublicCentral Europe and the BalticsChadChileChinaColombiaComorosCongo, Dem. Rep.Congo, Rep.Costa RicaCote d'IvoireCroatiaCubaCyprusCzech RepublicDenmarkDjiboutiDominicaDominican RepublicEarly-demographic dividendEast Asia & PacificEast Asia & Pacific (excluding high income)East Asia & Pacific (IDA & IBRD countries)EcuadorEgypt, Arab Rep.El SalvadorEquatorial GuineaEritreaEstoniaEthiopiaEuro areaEurope & Central AsiaEurope & Central Asia (excluding high income)Europe & Central Asia (IDA & IBRD countries)European UnionFaroe IslandsFijiFinlandFragile and conflict affected situationsFranceFrench PolynesiaGabonGambia, TheGeorgiaGermanyGhanaGreeceGreenlandGrenadaGuatemalaGuineaGuinea-BissauGuyanaHaitiHeavily indebted poor countries (HIPC)High incomeHondurasHong Kong SAR, ChinaHungaryIBRD onlyIcelandIDA & IBRD totalIDA blendIDA onlyIDA totalIndiaIndonesiaIran, Islamic Rep.IraqIrelandIsraelItalyJamaicaJapanJordanKazakhstanKenyaKiribatiKorea, Rep.KuwaitKyrgyz RepublicLao PDRLate-demographic dividendLatin America & Caribbean Latin America & Caribbean (excluding high income)Latin America & the Caribbean (IDA & IBRD countries)LatviaLeast developed countries: UN classificationLebanonLesothoLiberiaLibyaLithuaniaLow & middle incomeLow incomeLower middle incomeLuxembourgMacao SAR, ChinaMacedonia, FYRMadagascarMalawiMalaysiaMaldivesMaliMaltaMauritaniaMauritiusMexicoMiddle East & North AfricaMiddle East & North Africa (excluding high income)Middle East & North Africa (IDA & IBRD countries)Middle incomeMoldovaMongoliaMoroccoMozambiqueMyanmarNamibiaNepalNetherlandsNew CaledoniaNew ZealandNicaraguaNigerNigeriaNorth AmericaNorwayOECD membersOmanOther small statesPacific island small statesPakistanPalauPanamaPapua New GuineaParaguayPeruPhilippinesPolandPortugalPost-demographic dividendPre-demographic dividendQatarRomaniaRussian FederationRwandaSamoaSao Tome and PrincipeSaudi ArabiaSenegalSerbiaSeychellesSierra LeoneSingaporeSlovak RepublicSloveniaSmall statesSolomon IslandsSomaliaSouth AfricaSouth AsiaSouth Asia (IDA & IBRD)SpainSri LankaSt. Kitts and NevisSt. LuciaSt. Vincent and the GrenadinesSub-Saharan Africa Sub-Saharan Africa (excluding high income)Sub-Saharan Africa (IDA & IBRD countries)SudanSurinameSwazilandSwedenSwitzerlandSyrian Arab RepublicTajikistanTanzaniaThailandTimor-LesteTogoTongaTrinidad and TobagoTunisiaTurkeyTurkmenistanTurks and Caicos IslandsTuvaluUgandaUkraineUnited Arab EmiratesUnited KingdomUnited StatesUpper middle incomeUruguayVanuatuVenezuela, RBVietnamVirgin Islands (U.S.)WorldYemen, Rep.ZambiaZimbabwe línea de tiempo (timeline):
En esta escala de tiempo se presenta un gráfico de 1963 y 2016 de United States. Los datos de 1962 están ausentes. El número de observaciones reales por fecha: 54.
Fuente (nombre):
Indicadores del desarrollo mundial
Fuente (organización):
World Bank staff estimates from the Comtrade database maintained by the United Nations Statistics Division.
Categorías:
Private Sector, Trade
Se ha actualizado:
23 abr 2017 año
Los indicadores de los cambios de valor en los últimos años
Mínimo:
39.67
1 ene 1963 año
Máximo:
80.629
1 ene 1999 año
A la fecha de observación
Valor
Cambio absoluto
El cambio con respecto al valor anterior
1 ene 1963 año
39.67
+39.67
0.0%
1 ene 1964 año
40.747
+1.077
2.72%
1 ene 1965 año
43.353
+2.606
6.4%
1 ene 1966 año
46.727
+3.373
7.78%
1 ene 1967 año
50.372
+3.645
7.8%
1 ene 1968 año
52.79
+2.418
4.8%
1 ene 1969 año
56.225
+3.435
6.51%
1 ene 1970 año
59.592
+3.368
5.99%
1 ene 1971 año
60.703
+1.111
1.86%
1 ene 1972 año
63.35
+2.646
4.36%
1 ene 1973 año
64.459
+1.11
1.75%
1 ene 1974 año
61.225
-3.234
-5.02%
1 ene 1975 año
51.759
-9.467
-15.46%
1 ene 1976 año
51.098
-0.661
-1.28%
1 ene 1977 año
51.449
+0.351
0.69%
1 ene 1978 año
50.504
-0.945
-1.84%
1 ene 1979 año
56.092
+5.588
11.06%
1 ene 1980 año
52.018
-4.074
-7.26%
1 ene 1981 año
49.989
-2.028
-3.9%
1 ene 1982 año
52.729
+2.739
5.48%
1 ene 1983 año
57.731
+5.003
9.49%
1 ene 1984 año
61.222
+3.49
6.05%
1 ene 1985 año
66.394
+5.172
8.45%
1 ene 1986 año
70.15
+3.756
5.66%
1 ene 1987 año
75.116
+4.966
7.08%
1 ene 1988 año
75.159
+0.043
0.06%
1 ene 1989 año
76.718
+1.559
2.07%
1 ene 1990 año
74.88
-1.838
-2.4%
1 ene 1991 año
73.05
-1.83
-2.44%
1 ene 1992 año
75.211
+2.161
2.96%
1 ene 1993 año
76.256
+1.044
1.39%
1 ene 1994 año
77.561
+1.306
1.71%
1 ene 1995 año
78.673
+1.112
1.43%
1 ene 1996 año
79.204
+0.531
0.67%
1 ene 1997 año
77.964
-1.241
-1.57%
1 ene 1998 año
78.218
+0.255
0.33%
1 ene 1999 año
80.629
+2.411
3.08%
1 ene 2000 año
79.896
-0.733
-0.91%
1 ene 2001 año
77.218
-2.678
-3.35%
1 ene 2002 año
76.947
-0.271
-0.35%
1 ene 2003 año
77.931
+0.984
1.28%
1 ene 2004 año
76.113
-1.818
-2.33%
1 ene 2005 año
74.639
-1.474
-1.94%
1 ene 2006 año
71.826
-2.812
-3.77%
1 ene 2007 año
70.681
-1.145
-1.59%
1 ene 2008 año
70.184
-0.497
-0.7%
1 ene 2009 año
65.759
-4.425
-6.31%
1 ene 2010 año
70.495
+4.737
7.2%
1 ene 2011 año
70.103
-0.393
-0.56%
1 ene 2012 año
67.964
-2.138
-3.05%
1 ene 2013 año
70.068
+2.104
3.1%
1 ene 2014 año
71.597
+1.529
2.18%
1 ene 2015 año
73.236
+1.64
2.29%
1 ene 2016 año
78.87
+5.634
7.69%
Ranking de los países por los datos estadísticos actuales


Comentarios: