29
/es/
es
AIzaSyAYiBZKx7MnpbEhh9jyipgxe19OcubqV5w
April 1, 2024
275915
United Kingdom
GBR
true
2
1
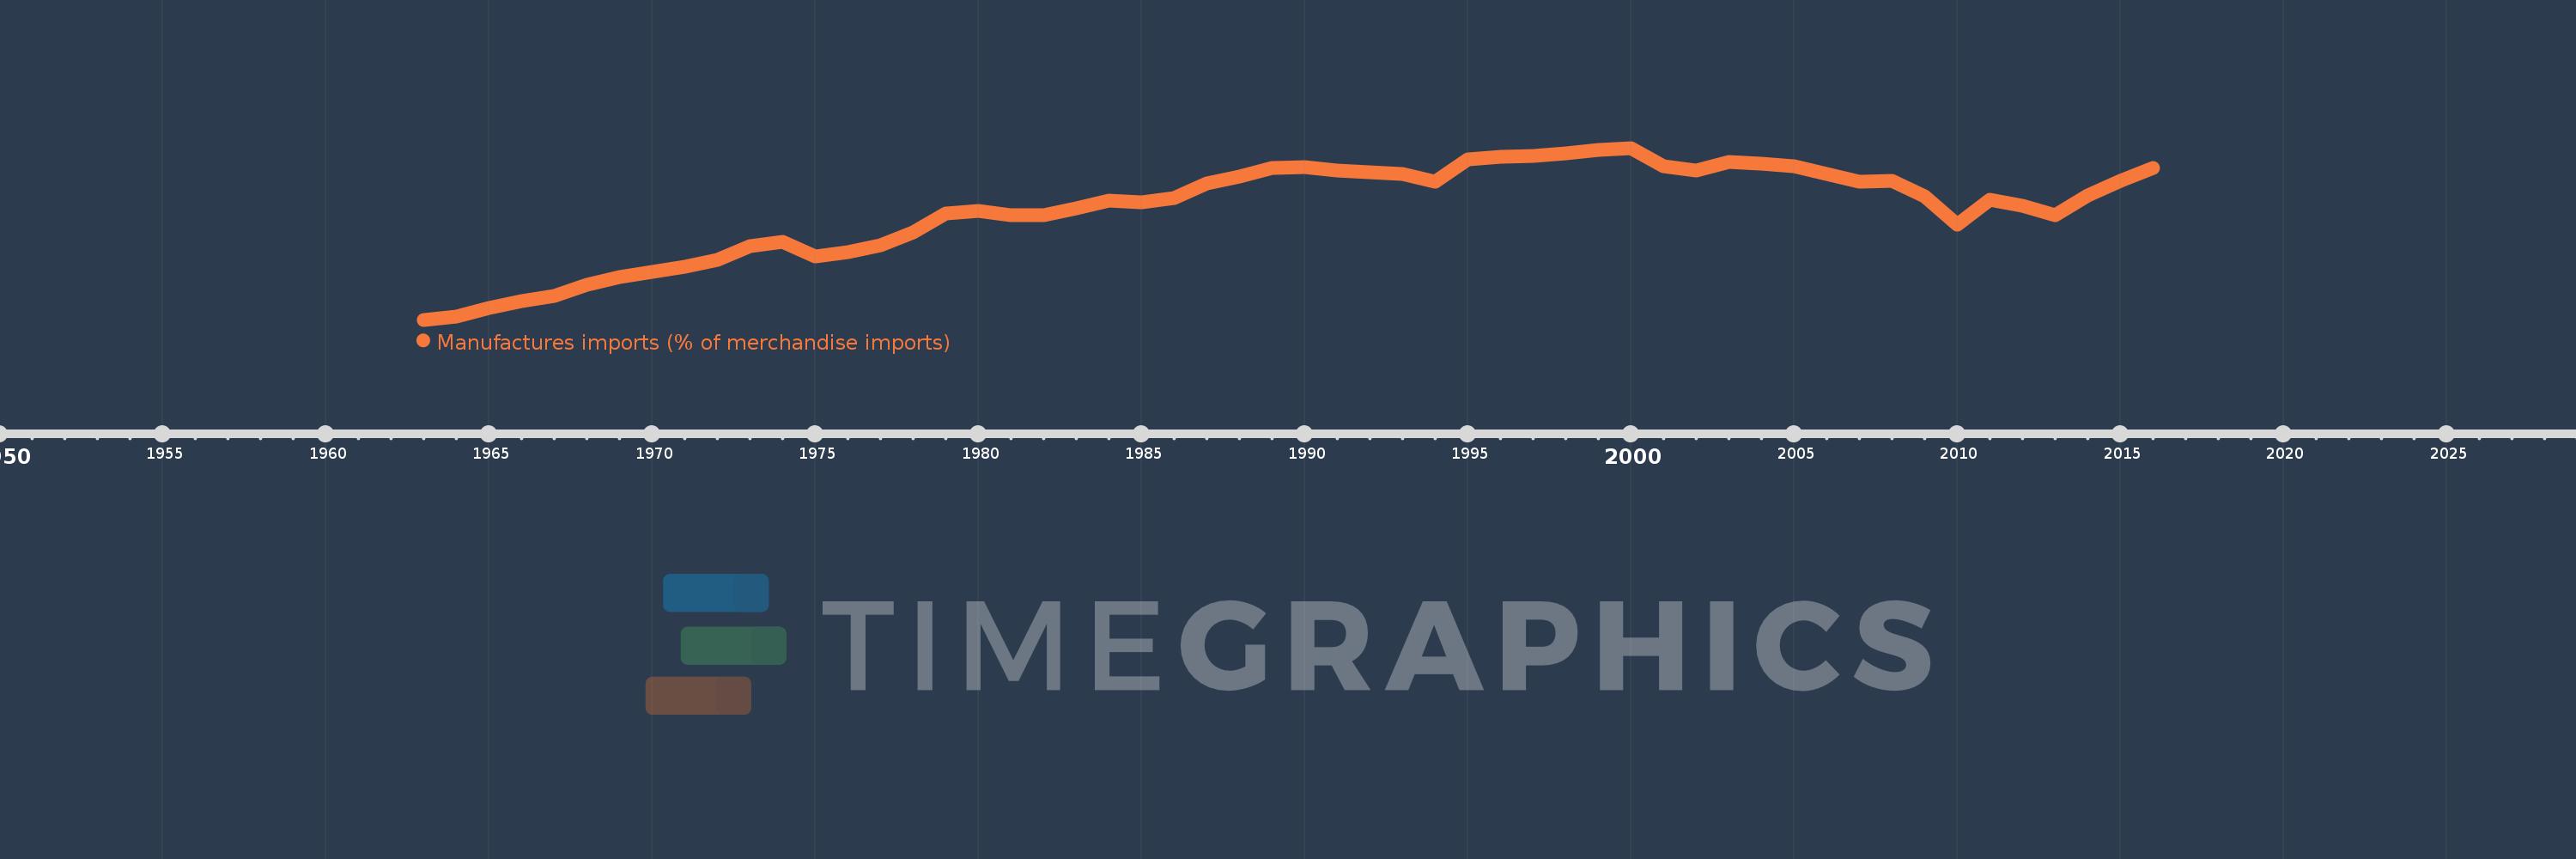
Manufactures imports (% of merchandise imports)
2016,2015,2014,2013,2012,2011,2010,2009,2008,2007,2006,2005,2004,2003,2002,2001,2000,1999,1998,1997,1996,1995,1994,1993,1992,1991,1990,1989,1988,1987,1986,1985,1984,1983,1982,1981,1980,1979,1978,1977,1976,1975,1974,1973,1972,1971,1970,1969,1968,1967,1966,1965,1964,1963
Estas estadísticas en otros países:
AfghanistanAlbaniaAlgeriaAndorraAngolaAntigua and BarbudaArab WorldArgentinaArmeniaArubaAustraliaAustriaAzerbaijanBahamas, TheBahrainBangladeshBarbadosBelarusBelgiumBelizeBeninBermudaBhutanBoliviaBosnia and HerzegovinaBotswanaBrazilBrunei DarussalamBulgariaBurkina FasoBurundiCabo VerdeCambodiaCameroonCanadaCaribbean small statesCayman IslandsCentral African RepublicCentral Europe and the BalticsChadChileChinaColombiaComorosCongo, Dem. Rep.Congo, Rep.Costa RicaCote d'IvoireCroatiaCubaCyprusCzech RepublicDenmarkDjiboutiDominicaDominican RepublicEarly-demographic dividendEast Asia & PacificEast Asia & Pacific (excluding high income)East Asia & Pacific (IDA & IBRD countries)EcuadorEgypt, Arab Rep.El SalvadorEquatorial GuineaEritreaEstoniaEthiopiaEuro areaEurope & Central AsiaEurope & Central Asia (excluding high income)Europe & Central Asia (IDA & IBRD countries)European UnionFaroe IslandsFijiFinlandFragile and conflict affected situationsFranceFrench PolynesiaGabonGambia, TheGeorgiaGermanyGhanaGreeceGreenlandGrenadaGuatemalaGuineaGuinea-BissauGuyanaHaitiHeavily indebted poor countries (HIPC)High incomeHondurasHong Kong SAR, ChinaHungaryIBRD onlyIcelandIDA & IBRD totalIDA blendIDA onlyIDA totalIndiaIndonesiaIran, Islamic Rep.IraqIrelandIsraelItalyJamaicaJapanJordanKazakhstanKenyaKiribatiKorea, Rep.KuwaitKyrgyz RepublicLao PDRLate-demographic dividendLatin America & Caribbean Latin America & Caribbean (excluding high income)Latin America & the Caribbean (IDA & IBRD countries)LatviaLeast developed countries: UN classificationLebanonLesothoLiberiaLibyaLithuaniaLow & middle incomeLow incomeLower middle incomeLuxembourgMacao SAR, ChinaMacedonia, FYRMadagascarMalawiMalaysiaMaldivesMaliMaltaMauritaniaMauritiusMexicoMiddle East & North AfricaMiddle East & North Africa (excluding high income)Middle East & North Africa (IDA & IBRD countries)Middle incomeMoldovaMongoliaMoroccoMozambiqueMyanmarNamibiaNepalNetherlandsNew CaledoniaNew ZealandNicaraguaNigerNigeriaNorth AmericaNorwayOECD membersOmanOther small statesPacific island small statesPakistanPalauPanamaPapua New GuineaParaguayPeruPhilippinesPolandPortugalPost-demographic dividendPre-demographic dividendQatarRomaniaRussian FederationRwandaSamoaSao Tome and PrincipeSaudi ArabiaSenegalSerbiaSeychellesSierra LeoneSingaporeSlovak RepublicSloveniaSmall statesSolomon IslandsSomaliaSouth AfricaSouth AsiaSouth Asia (IDA & IBRD)SpainSri LankaSt. Kitts and NevisSt. LuciaSt. Vincent and the GrenadinesSub-Saharan Africa Sub-Saharan Africa (excluding high income)Sub-Saharan Africa (IDA & IBRD countries)SudanSurinameSwazilandSwedenSwitzerlandSyrian Arab RepublicTajikistanTanzaniaThailandTimor-LesteTogoTongaTrinidad and TobagoTunisiaTurkeyTurkmenistanTurks and Caicos IslandsTuvaluUgandaUkraineUnited Arab EmiratesUnited KingdomUnited StatesUpper middle incomeUruguayVanuatuVenezuela, RBVietnamVirgin Islands (U.S.)WorldYemen, Rep.ZambiaZimbabwe línea de tiempo (timeline):
En esta escala de tiempo se presenta un gráfico de 1963 y 2016 de United Kingdom. Los datos de 1962 están ausentes. El número de observaciones reales por fecha: 54.
Fuente (nombre):
Indicadores del desarrollo mundial
Fuente (organización):
World Bank staff estimates from the Comtrade database maintained by the United Nations Statistics Division.
Categorías:
Private Sector, Trade
Se ha actualizado:
23 abr 2017 año
Los indicadores de los cambios de valor en los últimos años
Mínimo:
26.755
1 ene 1963 año
Máximo:
82.667
1 ene 2000 año
A la fecha de observación
Valor
Cambio absoluto
El cambio con respecto al valor anterior
1 ene 1963 año
26.755
+26.755
0.0%
1 ene 1964 año
27.656
+0.9
3.37%
1 ene 1965 año
30.502
+2.847
10.29%
1 ene 1966 año
32.707
+2.204
7.23%
1 ene 1967 año
34.412
+1.705
5.21%
1 ene 1968 año
38.246
+3.834
11.14%
1 ene 1969 año
40.564
+2.318
6.06%
1 ene 1970 año
42.414
+1.849
4.56%
1 ene 1971 año
43.874
+1.461
3.44%
1 ene 1972 año
46.258
+2.383
5.43%
1 ene 1973 año
50.693
+4.435
9.59%
1 ene 1974 año
52.059
+1.366
2.69%
1 ene 1975 año
47.234
-4.825
-9.27%
1 ene 1976 año
48.8
+1.566
3.32%
1 ene 1977 año
50.95
+2.149
4.4%
1 ene 1978 año
55.276
+4.326
8.49%
1 ene 1979 año
61.231
+5.955
10.77%
1 ene 1980 año
62.063
+0.832
1.36%
1 ene 1981 año
60.672
-1.391
-2.24%
1 ene 1982 año
60.811
+0.139
0.23%
1 ene 1983 año
63.002
+2.191
3.6%
1 ene 1984 año
65.556
+2.554
4.05%
1 ene 1985 año
64.855
-0.701
-1.07%
1 ene 1986 año
66.507
+1.652
2.55%
1 ene 1987 año
71.238
+4.731
7.11%
1 ene 1988 año
73.486
+2.248
3.16%
1 ene 1989 año
76.07
+2.584
3.52%
1 ene 1990 año
76.349
+0.279
0.37%
1 ene 1991 año
75.405
-0.944
-1.24%
1 ene 1992 año
74.835
-0.57
-0.76%
1 ene 1993 año
74.26
-0.574
-0.77%
1 ene 1994 año
71.543
-2.718
-3.66%
1 ene 1995 año
79.045
+7.502
10.49%
1 ene 1996 año
79.703
+0.658
0.83%
1 ene 1997 año
79.94
+0.237
0.3%
1 ene 1998 año
80.77
+0.83
1.04%
1 ene 1999 año
82.067
+1.297
1.61%
1 ene 2000 año
82.667
+0.6
0.73%
1 ene 2001 año
76.663
-6.005
-7.26%
1 ene 2002 año
75.177
-1.486
-1.94%
1 ene 2003 año
78.157
+2.98
3.96%
1 ene 2004 año
77.455
-0.702
-0.9%
1 ene 2005 año
76.773
-0.682
-0.88%
1 ene 2006 año
74.289
-2.484
-3.24%
1 ene 2007 año
71.725
-2.565
-3.45%
1 ene 2008 año
71.98
+0.255
0.36%
1 ene 2009 año
66.851
-5.129
-7.13%
1 ene 2010 año
57.748
-9.103
-13.62%
1 ene 2011 año
65.929
+8.181
14.17%
1 ene 2012 año
63.944
-1.985
-3.01%
1 ene 2013 año
60.87
-3.074
-4.81%
1 ene 2014 año
67.154
+6.284
10.32%
1 ene 2015 año
72.092
+4.938
7.35%
1 ene 2016 año
76.015
+3.923
5.44%
Ranking de los países por los datos estadísticos actuales


Comentarios: