29
/es/
es
AIzaSyAYiBZKx7MnpbEhh9jyipgxe19OcubqV5w
April 1, 2024
105121
Chile
CHL
true
2
1
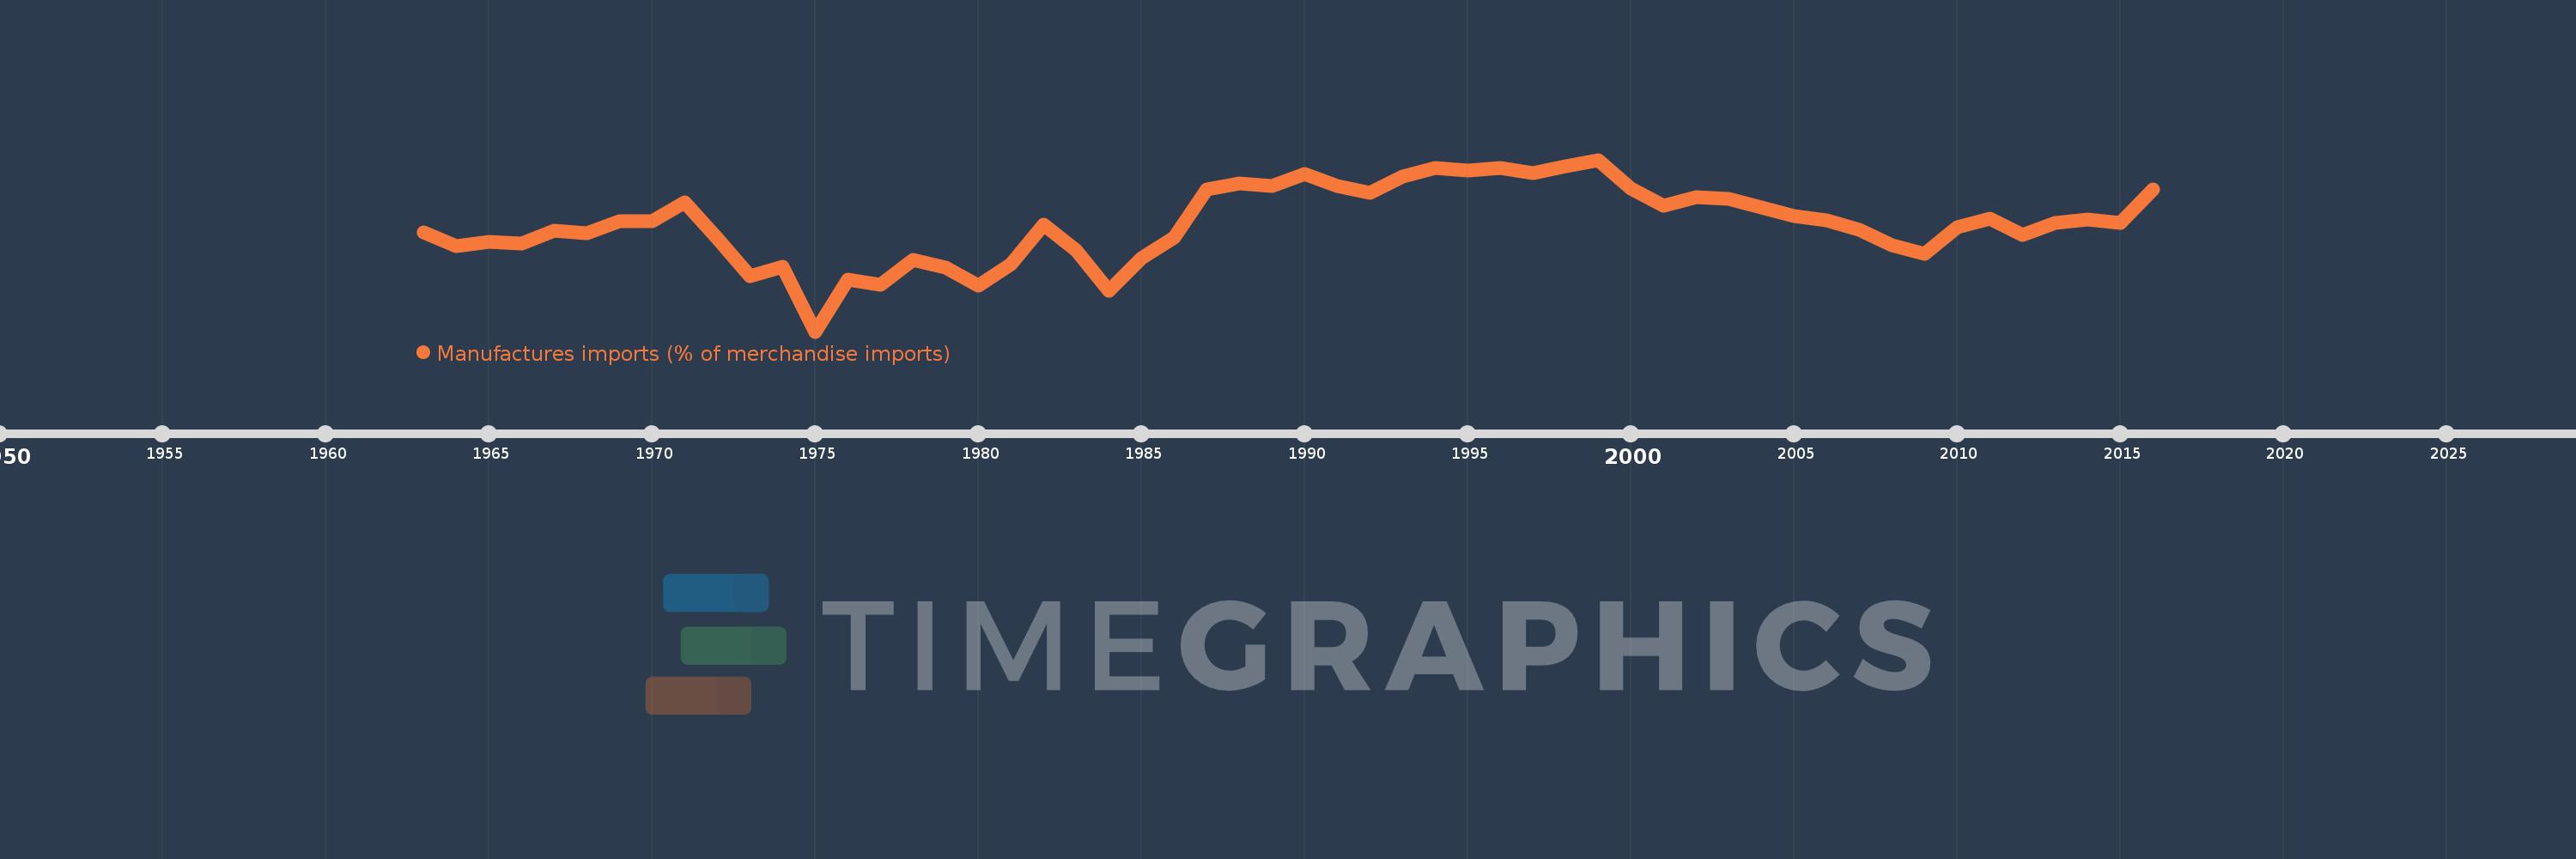
Manufactures imports (% of merchandise imports)
2016,2015,2014,2013,2012,2011,2010,2009,2008,2007,2006,2005,2004,2003,2002,2001,2000,1999,1998,1997,1996,1995,1994,1993,1992,1991,1990,1989,1988,1987,1986,1985,1984,1983,1982,1981,1980,1979,1978,1977,1976,1975,1974,1973,1972,1971,1970,1969,1968,1967,1966,1965,1964,1963
Estas estadísticas en otros países:
AfghanistanAlbaniaAlgeriaAndorraAngolaAntigua and BarbudaArab WorldArgentinaArmeniaArubaAustraliaAustriaAzerbaijanBahamas, TheBahrainBangladeshBarbadosBelarusBelgiumBelizeBeninBermudaBhutanBoliviaBosnia and HerzegovinaBotswanaBrazilBrunei DarussalamBulgariaBurkina FasoBurundiCabo VerdeCambodiaCameroonCanadaCaribbean small statesCayman IslandsCentral African RepublicCentral Europe and the BalticsChadChileChinaColombiaComorosCongo, Dem. Rep.Congo, Rep.Costa RicaCote d'IvoireCroatiaCubaCyprusCzech RepublicDenmarkDjiboutiDominicaDominican RepublicEarly-demographic dividendEast Asia & PacificEast Asia & Pacific (excluding high income)East Asia & Pacific (IDA & IBRD countries)EcuadorEgypt, Arab Rep.El SalvadorEquatorial GuineaEritreaEstoniaEthiopiaEuro areaEurope & Central AsiaEurope & Central Asia (excluding high income)Europe & Central Asia (IDA & IBRD countries)European UnionFaroe IslandsFijiFinlandFragile and conflict affected situationsFranceFrench PolynesiaGabonGambia, TheGeorgiaGermanyGhanaGreeceGreenlandGrenadaGuatemalaGuineaGuinea-BissauGuyanaHaitiHeavily indebted poor countries (HIPC)High incomeHondurasHong Kong SAR, ChinaHungaryIBRD onlyIcelandIDA & IBRD totalIDA blendIDA onlyIDA totalIndiaIndonesiaIran, Islamic Rep.IraqIrelandIsraelItalyJamaicaJapanJordanKazakhstanKenyaKiribatiKorea, Rep.KuwaitKyrgyz RepublicLao PDRLate-demographic dividendLatin America & Caribbean Latin America & Caribbean (excluding high income)Latin America & the Caribbean (IDA & IBRD countries)LatviaLeast developed countries: UN classificationLebanonLesothoLiberiaLibyaLithuaniaLow & middle incomeLow incomeLower middle incomeLuxembourgMacao SAR, ChinaMacedonia, FYRMadagascarMalawiMalaysiaMaldivesMaliMaltaMauritaniaMauritiusMexicoMiddle East & North AfricaMiddle East & North Africa (excluding high income)Middle East & North Africa (IDA & IBRD countries)Middle incomeMoldovaMongoliaMoroccoMozambiqueMyanmarNamibiaNepalNetherlandsNew CaledoniaNew ZealandNicaraguaNigerNigeriaNorth AmericaNorwayOECD membersOmanOther small statesPacific island small statesPakistanPalauPanamaPapua New GuineaParaguayPeruPhilippinesPolandPortugalPost-demographic dividendPre-demographic dividendQatarRomaniaRussian FederationRwandaSamoaSao Tome and PrincipeSaudi ArabiaSenegalSerbiaSeychellesSierra LeoneSingaporeSlovak RepublicSloveniaSmall statesSolomon IslandsSomaliaSouth AfricaSouth AsiaSouth Asia (IDA & IBRD)SpainSri LankaSt. Kitts and NevisSt. LuciaSt. Vincent and the GrenadinesSub-Saharan Africa Sub-Saharan Africa (excluding high income)Sub-Saharan Africa (IDA & IBRD countries)SudanSurinameSwazilandSwedenSwitzerlandSyrian Arab RepublicTajikistanTanzaniaThailandTimor-LesteTogoTongaTrinidad and TobagoTunisiaTurkeyTurkmenistanTurks and Caicos IslandsTuvaluUgandaUkraineUnited Arab EmiratesUnited KingdomUnited StatesUpper middle incomeUruguayVanuatuVenezuela, RBVietnamVirgin Islands (U.S.)WorldYemen, Rep.ZambiaZimbabwe línea de tiempo (timeline):
En esta escala de tiempo se presenta un gráfico de 1963 y 2016 de Chile. Los datos de 1962 están ausentes. El número de observaciones reales por fecha: 54.
Fuente (nombre):
Indicadores del desarrollo mundial
Fuente (organización):
World Bank staff estimates from the Comtrade database maintained by the United Nations Statistics Division.
Categorías:
Private Sector, Trade
Se ha actualizado:
23 abr 2017 año
Los indicadores de los cambios de valor en los últimos años
Mínimo:
45.891
1 ene 1975 año
Máximo:
80.729
1 ene 1999 año
A la fecha de observación
Valor
Cambio absoluto
El cambio con respecto al valor anterior
1 ene 1963 año
66.068
+66.068
0.0%
1 ene 1964 año
63.159
-2.909
-4.4%
1 ene 1965 año
64.086
+0.927
1.47%
1 ene 1966 año
63.745
-0.342
-0.53%
1 ene 1967 año
66.426
+2.681
4.21%
1 ene 1968 año
65.77
-0.656
-0.99%
1 ene 1969 año
68.279
+2.509
3.82%
1 ene 1970 año
68.301
+0.022
0.03%
1 ene 1971 año
72.086
+3.785
5.54%
1 ene 1972 año
64.797
-7.289
-10.11%
1 ene 1973 año
57.116
-7.681
-11.85%
1 ene 1974 año
59.065
+1.949
3.41%
1 ene 1975 año
45.891
-13.174
-22.3%
1 ene 1976 año
56.343
+10.452
22.78%
1 ene 1977 año
55.337
-1.006
-1.79%
1 ene 1978 año
60.379
+5.043
9.11%
1 ene 1979 año
58.884
-1.495
-2.48%
1 ene 1980 año
55.23
-3.654
-6.21%
1 ene 1981 año
59.551
+4.321
7.82%
1 ene 1982 año
67.524
+7.973
13.39%
1 ene 1983 año
62.307
-5.217
-7.73%
1 ene 1984 año
54.104
-8.203
-13.17%
1 ene 1985 año
60.859
+6.755
12.49%
1 ene 1986 año
64.922
+4.063
6.68%
1 ene 1987 año
74.722
+9.8
15.09%
1 ene 1988 año
75.986
+1.264
1.69%
1 ene 1989 año
75.502
-0.483
-0.64%
1 ene 1990 año
77.877
+2.375
3.15%
1 ene 1991 año
75.333
-2.544
-3.27%
1 ene 1992 año
73.983
-1.35
-1.79%
1 ene 1993 año
77.272
+3.289
4.45%
1 ene 1994 año
79.156
+1.884
2.44%
1 ene 1995 año
78.478
-0.678
-0.86%
1 ene 1996 año
79.143
+0.665
0.85%
1 ene 1997 año
78.079
-1.064
-1.34%
1 ene 1998 año
79.48
+1.401
1.79%
1 ene 1999 año
80.729
+1.248
1.57%
1 ene 2000 año
74.931
-5.798
-7.18%
1 ene 2001 año
71.352
-3.579
-4.78%
1 ene 2002 año
73.129
+1.778
2.49%
1 ene 2003 año
72.731
-0.398
-0.54%
1 ene 2004 año
71.097
-1.634
-2.25%
1 ene 2005 año
69.37
-1.727
-2.43%
1 ene 2006 año
68.39
-0.98
-1.41%
1 ene 2007 año
66.493
-1.897
-2.77%
1 ene 2008 año
63.469
-3.024
-4.55%
1 ene 2009 año
61.612
-1.856
-2.92%
1 ene 2010 año
67.028
+5.416
8.79%
1 ene 2011 año
68.723
+1.695
2.53%
1 ene 2012 año
65.429
-3.294
-4.79%
1 ene 2013 año
67.917
+2.488
3.8%
1 ene 2014 año
68.64
+0.723
1.06%
1 ene 2015 año
67.859
-0.781
-1.14%
1 ene 2016 año
74.651
+6.792
10.01%
Ranking de los países por los datos estadísticos actuales


Comentarios: