29
/es/
es
AIzaSyAYiBZKx7MnpbEhh9jyipgxe19OcubqV5w
April 1, 2024
268251
Tunisia
TUN
true
2
1
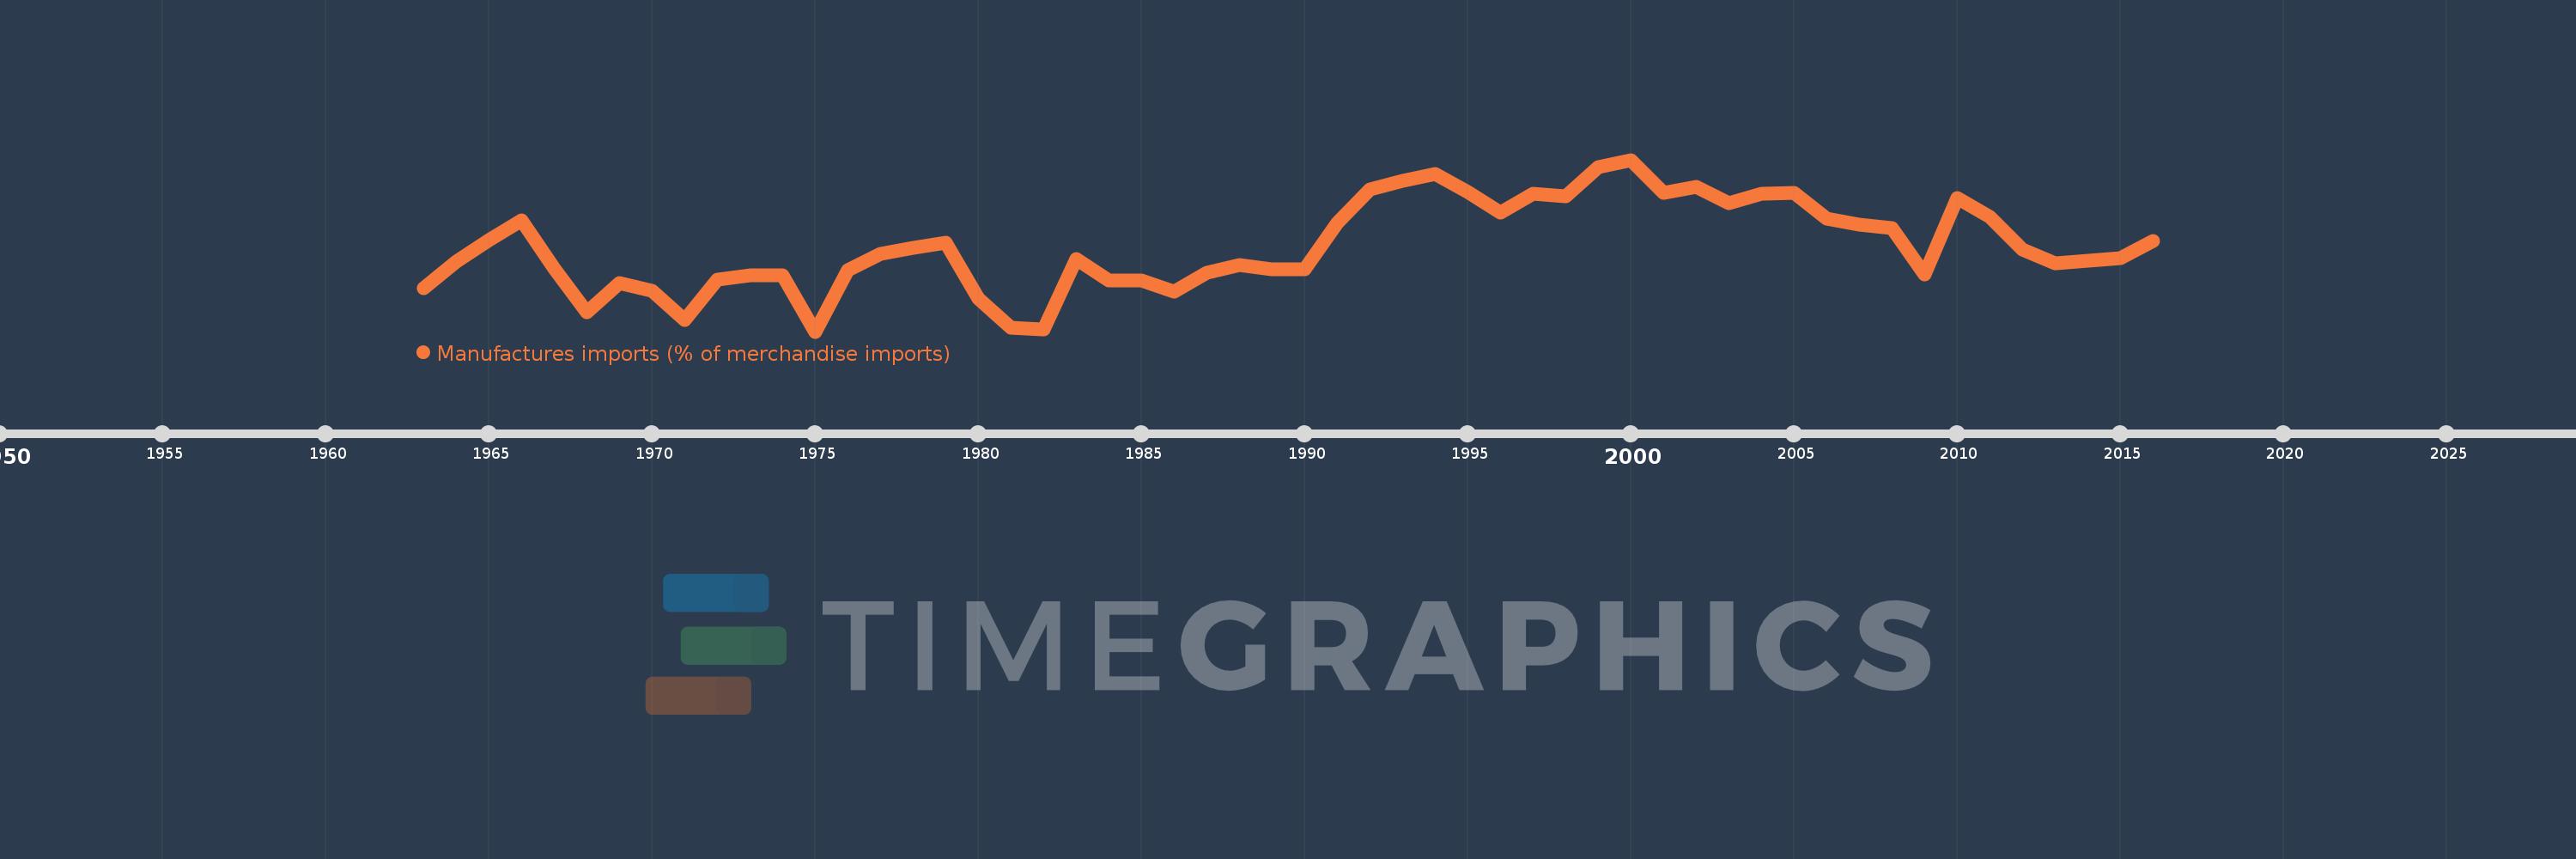
Manufactures imports (% of merchandise imports)
2016,2015,2014,2013,2012,2011,2010,2009,2008,2007,2006,2005,2004,2003,2002,2001,2000,1999,1998,1997,1996,1995,1994,1993,1992,1991,1990,1989,1988,1987,1986,1985,1984,1983,1982,1981,1980,1979,1978,1977,1976,1975,1974,1973,1972,1971,1970,1969,1968,1967,1966,1965,1964,1963
Estas estadísticas en otros países:
AfghanistanAlbaniaAlgeriaAndorraAngolaAntigua and BarbudaArab WorldArgentinaArmeniaArubaAustraliaAustriaAzerbaijanBahamas, TheBahrainBangladeshBarbadosBelarusBelgiumBelizeBeninBermudaBhutanBoliviaBosnia and HerzegovinaBotswanaBrazilBrunei DarussalamBulgariaBurkina FasoBurundiCabo VerdeCambodiaCameroonCanadaCaribbean small statesCayman IslandsCentral African RepublicCentral Europe and the BalticsChadChileChinaColombiaComorosCongo, Dem. Rep.Congo, Rep.Costa RicaCote d'IvoireCroatiaCubaCyprusCzech RepublicDenmarkDjiboutiDominicaDominican RepublicEarly-demographic dividendEast Asia & PacificEast Asia & Pacific (excluding high income)East Asia & Pacific (IDA & IBRD countries)EcuadorEgypt, Arab Rep.El SalvadorEquatorial GuineaEritreaEstoniaEthiopiaEuro areaEurope & Central AsiaEurope & Central Asia (excluding high income)Europe & Central Asia (IDA & IBRD countries)European UnionFaroe IslandsFijiFinlandFragile and conflict affected situationsFranceFrench PolynesiaGabonGambia, TheGeorgiaGermanyGhanaGreeceGreenlandGrenadaGuatemalaGuineaGuinea-BissauGuyanaHaitiHeavily indebted poor countries (HIPC)High incomeHondurasHong Kong SAR, ChinaHungaryIBRD onlyIcelandIDA & IBRD totalIDA blendIDA onlyIDA totalIndiaIndonesiaIran, Islamic Rep.IraqIrelandIsraelItalyJamaicaJapanJordanKazakhstanKenyaKiribatiKorea, Rep.KuwaitKyrgyz RepublicLao PDRLate-demographic dividendLatin America & Caribbean Latin America & Caribbean (excluding high income)Latin America & the Caribbean (IDA & IBRD countries)LatviaLeast developed countries: UN classificationLebanonLesothoLiberiaLibyaLithuaniaLow & middle incomeLow incomeLower middle incomeLuxembourgMacao SAR, ChinaMacedonia, FYRMadagascarMalawiMalaysiaMaldivesMaliMaltaMauritaniaMauritiusMexicoMiddle East & North AfricaMiddle East & North Africa (excluding high income)Middle East & North Africa (IDA & IBRD countries)Middle incomeMoldovaMongoliaMoroccoMozambiqueMyanmarNamibiaNepalNetherlandsNew CaledoniaNew ZealandNicaraguaNigerNigeriaNorth AmericaNorwayOECD membersOmanOther small statesPacific island small statesPakistanPalauPanamaPapua New GuineaParaguayPeruPhilippinesPolandPortugalPost-demographic dividendPre-demographic dividendQatarRomaniaRussian FederationRwandaSamoaSao Tome and PrincipeSaudi ArabiaSenegalSerbiaSeychellesSierra LeoneSingaporeSlovak RepublicSloveniaSmall statesSolomon IslandsSomaliaSouth AfricaSouth AsiaSouth Asia (IDA & IBRD)SpainSri LankaSt. Kitts and NevisSt. LuciaSt. Vincent and the GrenadinesSub-Saharan Africa Sub-Saharan Africa (excluding high income)Sub-Saharan Africa (IDA & IBRD countries)SudanSurinameSwazilandSwedenSwitzerlandSyrian Arab RepublicTajikistanTanzaniaThailandTimor-LesteTogoTongaTrinidad and TobagoTunisiaTurkeyTurkmenistanTurks and Caicos IslandsTuvaluUgandaUkraineUnited Arab EmiratesUnited KingdomUnited StatesUpper middle incomeUruguayVanuatuVenezuela, RBVietnamVirgin Islands (U.S.)WorldYemen, Rep.ZambiaZimbabwe línea de tiempo (timeline):
En esta escala de tiempo se presenta un gráfico de 1963 y 2016 de Tunisia. Los datos de 1962 están ausentes. El número de observaciones reales por fecha: 54.
Fuente (nombre):
Indicadores del desarrollo mundial
Fuente (organización):
World Bank staff estimates from the Comtrade database maintained by the United Nations Statistics Division.
Categorías:
Private Sector, Trade
Se ha actualizado:
23 abr 2017 año
Los indicadores de los cambios de valor en los últimos años
Mínimo:
56.974
1 ene 1975 año
Máximo:
79.962
1 ene 2000 año
A la fecha de observación
Valor
Cambio absoluto
El cambio con respecto al valor anterior
1 ene 1963 año
62.803
+62.803
0.0%
1 ene 1964 año
66.358
+3.555
5.66%
1 ene 1965 año
69.199
+2.841
4.28%
1 ene 1966 año
71.891
+2.692
3.89%
1 ene 1967 año
65.399
-6.492
-9.03%
1 ene 1968 año
59.589
-5.811
-8.88%
1 ene 1969 año
63.413
+3.824
6.42%
1 ene 1970 año
62.408
-1.005
-1.59%
1 ene 1971 año
58.514
-3.893
-6.24%
1 ene 1972 año
63.901
+5.387
9.21%
1 ene 1973 año
64.526
+0.625
0.98%
1 ene 1974 año
64.479
-0.047
-0.07%
1 ene 1975 año
56.974
-7.505
-11.64%
1 ene 1976 año
65.17
+8.196
14.39%
1 ene 1977 año
67.416
+2.246
3.45%
1 ene 1978 año
68.151
+0.735
1.09%
1 ene 1979 año
68.837
+0.686
1.01%
1 ene 1980 año
61.372
-7.465
-10.84%
1 ene 1981 año
57.508
-3.864
-6.3%
1 ene 1982 año
57.206
-0.302
-0.52%
1 ene 1983 año
66.727
+9.521
16.64%
1 ene 1984 año
63.795
-2.932
-4.39%
1 ene 1985 año
63.828
+0.033
0.05%
1 ene 1986 año
62.341
-1.487
-2.33%
1 ene 1987 año
64.846
+2.505
4.02%
1 ene 1988 año
65.894
+1.048
1.62%
1 ene 1989 año
65.345
-0.549
-0.83%
1 ene 1990 año
65.348
+0.003
0.0%
1 ene 1991 año
71.559
+6.211
9.5%
1 ene 1992 año
75.941
+4.382
6.12%
1 ene 1993 año
77.1
+1.159
1.53%
1 ene 1994 año
78.027
+0.926
1.2%
1 ene 1995 año
75.6
-2.427
-3.11%
1 ene 1996 año
72.899
-2.701
-3.57%
1 ene 1997 año
75.472
+2.573
3.53%
1 ene 1998 año
75.107
-0.365
-0.48%
1 ene 1999 año
78.953
+3.846
5.12%
1 ene 2000 año
79.962
+1.008
1.28%
1 ene 2001 año
75.578
-4.384
-5.48%
1 ene 2002 año
76.382
+0.804
1.06%
1 ene 2003 año
74.145
-2.237
-2.93%
1 ene 2004 año
75.437
+1.292
1.74%
1 ene 2005 año
75.553
+0.116
0.15%
1 ene 2006 año
72.034
-3.519
-4.66%
1 ene 2007 año
71.239
-0.794
-1.1%
1 ene 2008 año
70.797
-0.443
-0.62%
1 ene 2009 año
64.587
-6.21
-8.77%
1 ene 2010 año
74.813
+10.226
15.83%
1 ene 2011 año
72.295
-2.518
-3.37%
1 ene 2012 año
67.923
-4.371
-6.05%
1 ene 2013 año
66.089
-1.834
-2.7%
1 ene 2014 año
66.416
+0.326
0.49%
1 ene 2015 año
66.772
+0.356
0.54%
1 ene 2016 año
69.093
+2.321
3.48%
Ranking de los países por los datos estadísticos actuales


Comentarios: