29
/es/
es
AIzaSyAYiBZKx7MnpbEhh9jyipgxe19OcubqV5w
April 1, 2024
253268
Sudan
SDN
true
2
1
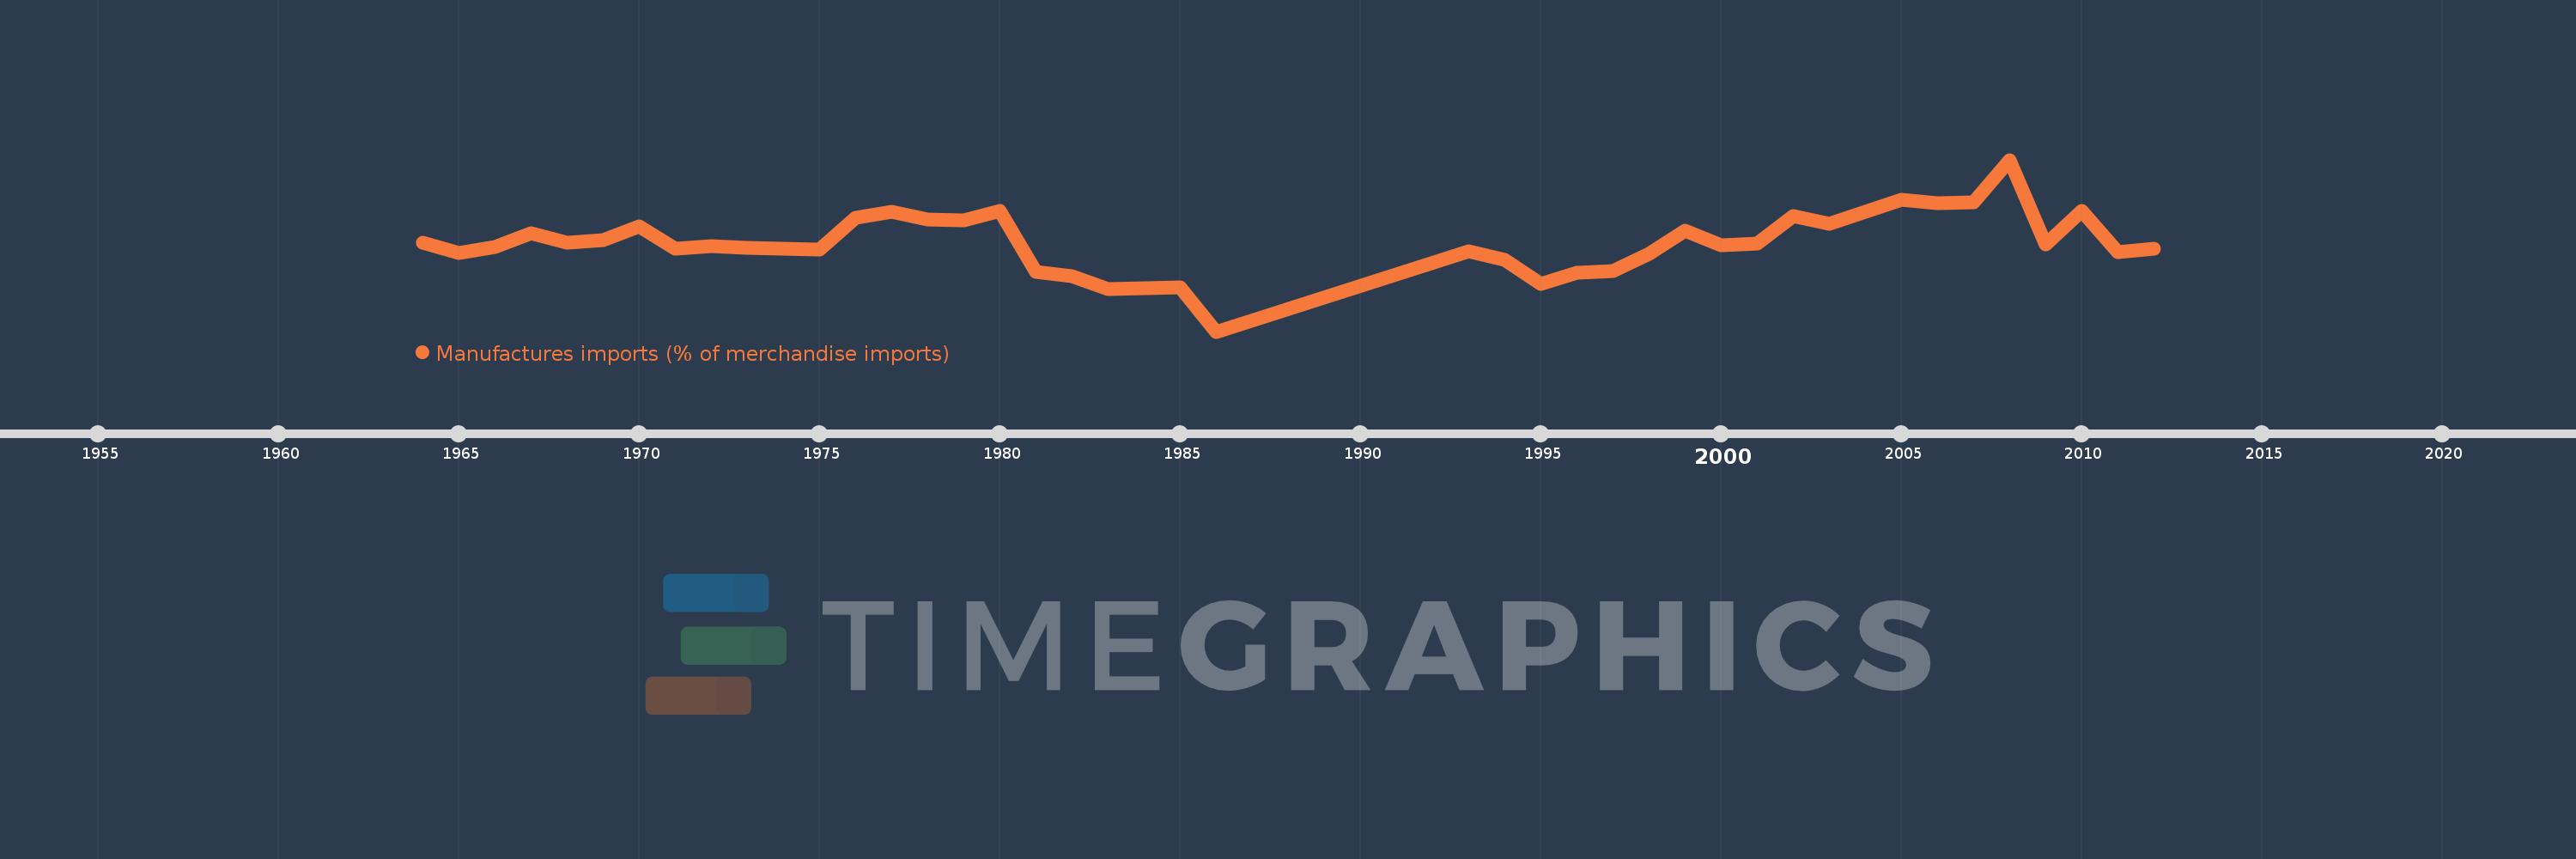
Manufactures imports (% of merchandise imports)
2012,2011,2010,2009,2008,2007,2006,2005,2004,2003,2002,2001,2000,1999,1998,1997,1996,1995,1994,1993,1986,1985,1983,1982,1981,1980,1979,1978,1977,1976,1975,1974,1973,1972,1971,1970,1969,1968,1967,1966,1965,1964
Estas estadísticas en otros países:
AfghanistanAlbaniaAlgeriaAndorraAngolaAntigua and BarbudaArab WorldArgentinaArmeniaArubaAustraliaAustriaAzerbaijanBahamas, TheBahrainBangladeshBarbadosBelarusBelgiumBelizeBeninBermudaBhutanBoliviaBosnia and HerzegovinaBotswanaBrazilBrunei DarussalamBulgariaBurkina FasoBurundiCabo VerdeCambodiaCameroonCanadaCaribbean small statesCayman IslandsCentral African RepublicCentral Europe and the BalticsChadChileChinaColombiaComorosCongo, Dem. Rep.Congo, Rep.Costa RicaCote d'IvoireCroatiaCubaCyprusCzech RepublicDenmarkDjiboutiDominicaDominican RepublicEarly-demographic dividendEast Asia & PacificEast Asia & Pacific (excluding high income)East Asia & Pacific (IDA & IBRD countries)EcuadorEgypt, Arab Rep.El SalvadorEquatorial GuineaEritreaEstoniaEthiopiaEuro areaEurope & Central AsiaEurope & Central Asia (excluding high income)Europe & Central Asia (IDA & IBRD countries)European UnionFaroe IslandsFijiFinlandFragile and conflict affected situationsFranceFrench PolynesiaGabonGambia, TheGeorgiaGermanyGhanaGreeceGreenlandGrenadaGuatemalaGuineaGuinea-BissauGuyanaHaitiHeavily indebted poor countries (HIPC)High incomeHondurasHong Kong SAR, ChinaHungaryIBRD onlyIcelandIDA & IBRD totalIDA blendIDA onlyIDA totalIndiaIndonesiaIran, Islamic Rep.IraqIrelandIsraelItalyJamaicaJapanJordanKazakhstanKenyaKiribatiKorea, Rep.KuwaitKyrgyz RepublicLao PDRLate-demographic dividendLatin America & Caribbean Latin America & Caribbean (excluding high income)Latin America & the Caribbean (IDA & IBRD countries)LatviaLeast developed countries: UN classificationLebanonLesothoLiberiaLibyaLithuaniaLow & middle incomeLow incomeLower middle incomeLuxembourgMacao SAR, ChinaMacedonia, FYRMadagascarMalawiMalaysiaMaldivesMaliMaltaMauritaniaMauritiusMexicoMiddle East & North AfricaMiddle East & North Africa (excluding high income)Middle East & North Africa (IDA & IBRD countries)Middle incomeMoldovaMongoliaMoroccoMozambiqueMyanmarNamibiaNepalNetherlandsNew CaledoniaNew ZealandNicaraguaNigerNigeriaNorth AmericaNorwayOECD membersOmanOther small statesPacific island small statesPakistanPalauPanamaPapua New GuineaParaguayPeruPhilippinesPolandPortugalPost-demographic dividendPre-demographic dividendQatarRomaniaRussian FederationRwandaSamoaSao Tome and PrincipeSaudi ArabiaSenegalSerbiaSeychellesSierra LeoneSingaporeSlovak RepublicSloveniaSmall statesSolomon IslandsSomaliaSouth AfricaSouth AsiaSouth Asia (IDA & IBRD)SpainSri LankaSt. Kitts and NevisSt. LuciaSt. Vincent and the GrenadinesSub-Saharan Africa Sub-Saharan Africa (excluding high income)Sub-Saharan Africa (IDA & IBRD countries)SudanSurinameSwazilandSwedenSwitzerlandSyrian Arab RepublicTajikistanTanzaniaThailandTimor-LesteTogoTongaTrinidad and TobagoTunisiaTurkeyTurkmenistanTurks and Caicos IslandsTuvaluUgandaUkraineUnited Arab EmiratesUnited KingdomUnited StatesUpper middle incomeUruguayVanuatuVenezuela, RBVietnamVirgin Islands (U.S.)WorldYemen, Rep.ZambiaZimbabwe línea de tiempo (timeline):
En esta escala de tiempo se presenta un gráfico de 1964 y 2012 de Sudan. Los datos de 1963 están ausentes. El número de observaciones reales por fecha: 42.
Fuente (nombre):
Indicadores del desarrollo mundial
Fuente (organización):
World Bank staff estimates from the Comtrade database maintained by the United Nations Statistics Division.
Categorías:
Private Sector, Trade
Se ha actualizado:
23 abr 2017 año
Los indicadores de los cambios de valor en los últimos años
Mínimo:
41.887
1 ene 1986 año
Máximo:
92.991
1 ene 2008 año
A la fecha de observación
Valor
Cambio absoluto
El cambio con respecto al valor anterior
1 ene 1964 año
68.371
+68.371
0.0%
1 ene 1965 año
65.298
-3.073
-4.49%
1 ene 1966 año
67.133
+1.835
2.81%
1 ene 1967 año
71.046
+3.913
5.83%
1 ene 1968 año
68.211
-2.835
-3.99%
1 ene 1969 año
69.159
+0.948
1.39%
1 ene 1970 año
73.193
+4.034
5.83%
1 ene 1971 año
66.585
-6.609
-9.03%
1 ene 1972 año
67.439
+0.854
1.28%
1 ene 1973 año
66.777
-0.661
-0.98%
1 ene 1974 año
66.529
-0.249
-0.37%
1 ene 1975 año
66.318
-0.211
-0.32%
1 ene 1976 año
75.808
+9.49
14.31%
1 ene 1977 año
77.534
+1.726
2.28%
1 ene 1978 año
75.124
-2.409
-3.11%
1 ene 1979 año
75.035
-0.089
-0.12%
1 ene 1980 año
77.766
+2.731
3.64%
1 ene 1981 año
59.644
-18.122
-23.3%
1 ene 1982 año
58.361
-1.283
-2.15%
1 ene 1983 año
54.663
-3.698
-6.34%
1 ene 1985 año
54.967
+0.304
0.56%
1 ene 1986 año
41.887
-13.08
-23.8%
1 ene 1993 año
65.76
+23.873
56.99%
1 ene 1994 año
63.264
-2.496
-3.8%
1 ene 1995 año
56.022
-7.242
-11.45%
1 ene 1996 año
59.439
+3.416
6.1%
1 ene 1997 año
59.934
+0.495
0.83%
1 ene 1998 año
64.992
+5.058
8.44%
1 ene 1999 año
71.889
+6.898
10.61%
1 ene 2000 año
67.647
-4.242
-5.9%
1 ene 2001 año
67.964
+0.317
0.47%
1 ene 2002 año
76.341
+8.378
12.33%
1 ene 2003 año
74.034
-2.307
-3.02%
1 ene 2004 año
77.443
+3.409
4.61%
1 ene 2005 año
81.177
+3.734
4.82%
1 ene 2006 año
79.96
-1.217
-1.5%
1 ene 2007 año
80.439
+0.478
0.6%
1 ene 2008 año
92.991
+12.552
15.6%
1 ene 2009 año
67.695
-25.295
-27.2%
1 ene 2010 año
77.837
+10.142
14.98%
1 ene 2011 año
65.564
-12.273
-15.77%
1 ene 2012 año
66.589
+1.025
1.56%
Ranking de los países por los datos estadísticos actuales


Comentarios: