29
/es/
es
AIzaSyAYiBZKx7MnpbEhh9jyipgxe19OcubqV5w
April 1, 2024
207016
Nepal
NPL
true
2
1
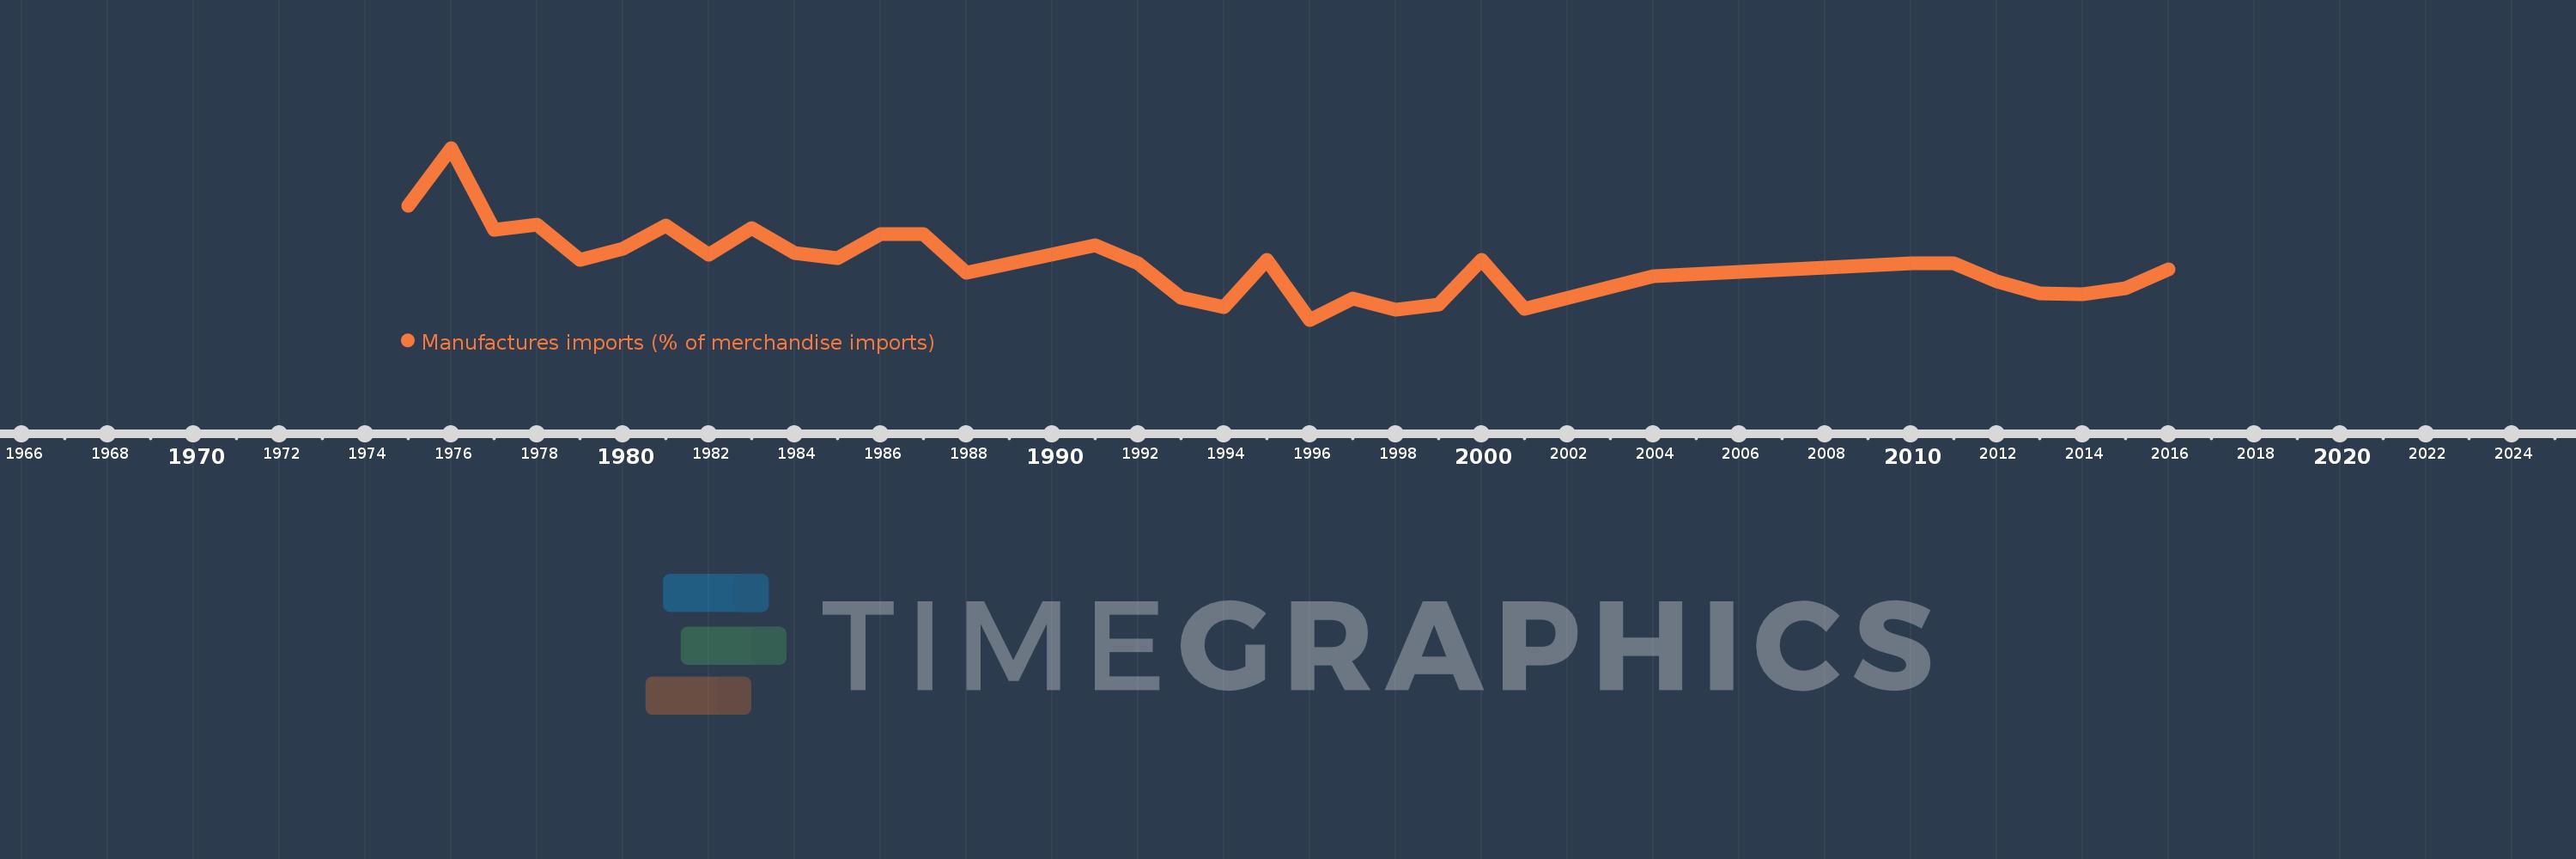
Manufactures imports (% of merchandise imports)
2016,2015,2014,2013,2012,2011,2010,2004,2001,2000,1999,1998,1997,1996,1995,1994,1993,1992,1991,1988,1987,1986,1985,1984,1983,1982,1981,1980,1979,1978,1977,1976,1975
Estas estadísticas en otros países:
AfghanistanAlbaniaAlgeriaAndorraAngolaAntigua and BarbudaArab WorldArgentinaArmeniaArubaAustraliaAustriaAzerbaijanBahamas, TheBahrainBangladeshBarbadosBelarusBelgiumBelizeBeninBermudaBhutanBoliviaBosnia and HerzegovinaBotswanaBrazilBrunei DarussalamBulgariaBurkina FasoBurundiCabo VerdeCambodiaCameroonCanadaCaribbean small statesCayman IslandsCentral African RepublicCentral Europe and the BalticsChadChileChinaColombiaComorosCongo, Dem. Rep.Congo, Rep.Costa RicaCote d'IvoireCroatiaCubaCyprusCzech RepublicDenmarkDjiboutiDominicaDominican RepublicEarly-demographic dividendEast Asia & PacificEast Asia & Pacific (excluding high income)East Asia & Pacific (IDA & IBRD countries)EcuadorEgypt, Arab Rep.El SalvadorEquatorial GuineaEritreaEstoniaEthiopiaEuro areaEurope & Central AsiaEurope & Central Asia (excluding high income)Europe & Central Asia (IDA & IBRD countries)European UnionFaroe IslandsFijiFinlandFragile and conflict affected situationsFranceFrench PolynesiaGabonGambia, TheGeorgiaGermanyGhanaGreeceGreenlandGrenadaGuatemalaGuineaGuinea-BissauGuyanaHaitiHeavily indebted poor countries (HIPC)High incomeHondurasHong Kong SAR, ChinaHungaryIBRD onlyIcelandIDA & IBRD totalIDA blendIDA onlyIDA totalIndiaIndonesiaIran, Islamic Rep.IraqIrelandIsraelItalyJamaicaJapanJordanKazakhstanKenyaKiribatiKorea, Rep.KuwaitKyrgyz RepublicLao PDRLate-demographic dividendLatin America & Caribbean Latin America & Caribbean (excluding high income)Latin America & the Caribbean (IDA & IBRD countries)LatviaLeast developed countries: UN classificationLebanonLesothoLiberiaLibyaLithuaniaLow & middle incomeLow incomeLower middle incomeLuxembourgMacao SAR, ChinaMacedonia, FYRMadagascarMalawiMalaysiaMaldivesMaliMaltaMauritaniaMauritiusMexicoMiddle East & North AfricaMiddle East & North Africa (excluding high income)Middle East & North Africa (IDA & IBRD countries)Middle incomeMoldovaMongoliaMoroccoMozambiqueMyanmarNamibiaNepalNetherlandsNew CaledoniaNew ZealandNicaraguaNigerNigeriaNorth AmericaNorwayOECD membersOmanOther small statesPacific island small statesPakistanPalauPanamaPapua New GuineaParaguayPeruPhilippinesPolandPortugalPost-demographic dividendPre-demographic dividendQatarRomaniaRussian FederationRwandaSamoaSao Tome and PrincipeSaudi ArabiaSenegalSerbiaSeychellesSierra LeoneSingaporeSlovak RepublicSloveniaSmall statesSolomon IslandsSomaliaSouth AfricaSouth AsiaSouth Asia (IDA & IBRD)SpainSri LankaSt. Kitts and NevisSt. LuciaSt. Vincent and the GrenadinesSub-Saharan Africa Sub-Saharan Africa (excluding high income)Sub-Saharan Africa (IDA & IBRD countries)SudanSurinameSwazilandSwedenSwitzerlandSyrian Arab RepublicTajikistanTanzaniaThailandTimor-LesteTogoTongaTrinidad and TobagoTunisiaTurkeyTurkmenistanTurks and Caicos IslandsTuvaluUgandaUkraineUnited Arab EmiratesUnited KingdomUnited StatesUpper middle incomeUruguayVanuatuVenezuela, RBVietnamVirgin Islands (U.S.)WorldYemen, Rep.ZambiaZimbabwe línea de tiempo (timeline):
En esta escala de tiempo se presenta un gráfico de 1975 y 2016 de Nepal. Los datos de 1974 están ausentes. El número de observaciones reales por fecha: 33.
Fuente (nombre):
Indicadores del desarrollo mundial
Fuente (organización):
World Bank staff estimates from the Comtrade database maintained by the United Nations Statistics Division.
Categorías:
Private Sector, Trade
Se ha actualizado:
23 abr 2017 año
Los indicadores de los cambios de valor en los últimos años
Mínimo:
45.913
1 ene 1996 año
Máximo:
95.639
1 ene 1976 año
A la fecha de observación
Valor
Cambio absoluto
El cambio con respecto al valor anterior
1 ene 1975 año
78.872
+78.872
0.0%
1 ene 1976 año
95.639
+16.766
21.26%
1 ene 1977 año
72.05
-23.589
-24.66%
1 ene 1978 año
73.32
+1.27
1.76%
1 ene 1979 año
63.295
-10.025
-13.67%
1 ene 1980 año
66.553
+3.257
5.15%
1 ene 1981 año
73.143
+6.59
9.9%
1 ene 1982 año
64.665
-8.478
-11.59%
1 ene 1983 año
72.485
+7.82
12.09%
1 ene 1984 año
65.355
-7.13
-9.84%
1 ene 1985 año
63.652
-1.703
-2.61%
1 ene 1986 año
70.711
+7.059
11.09%
1 ene 1987 año
70.779
+0.069
0.1%
1 ene 1988 año
59.396
-11.384
-16.08%
1 ene 1991 año
67.4
+8.004
13.48%
1 ene 1992 año
62.201
-5.199
-7.71%
1 ene 1993 año
52.401
-9.8
-15.76%
1 ene 1994 año
49.453
-2.948
-5.63%
1 ene 1995 año
63.144
+13.691
27.69%
1 ene 1996 año
45.913
-17.232
-27.29%
1 ene 1997 año
52.019
+6.106
13.3%
1 ene 1998 año
48.772
-3.247
-6.24%
1 ene 1999 año
50.378
+1.606
3.29%
1 ene 2000 año
63.282
+12.904
25.61%
1 ene 2001 año
49.07
-14.212
-22.46%
1 ene 2004 año
58.541
+9.471
19.3%
1 ene 2010 año
62.187
+3.646
6.23%
1 ene 2011 año
62.143
-0.044
-0.07%
1 ene 2012 año
56.912
-5.231
-8.42%
1 ene 2013 año
53.508
-3.404
-5.98%
1 ene 2014 año
53.238
-0.27
-0.5%
1 ene 2015 año
54.932
+1.694
3.18%
1 ene 2016 año
60.485
+5.553
10.11%
Ranking de los países por los datos estadísticos actuales


Comentarios: