29
/es/
es
AIzaSyAYiBZKx7MnpbEhh9jyipgxe19OcubqV5w
April 1, 2024
87498
Bolivia
BOL
true
2
1
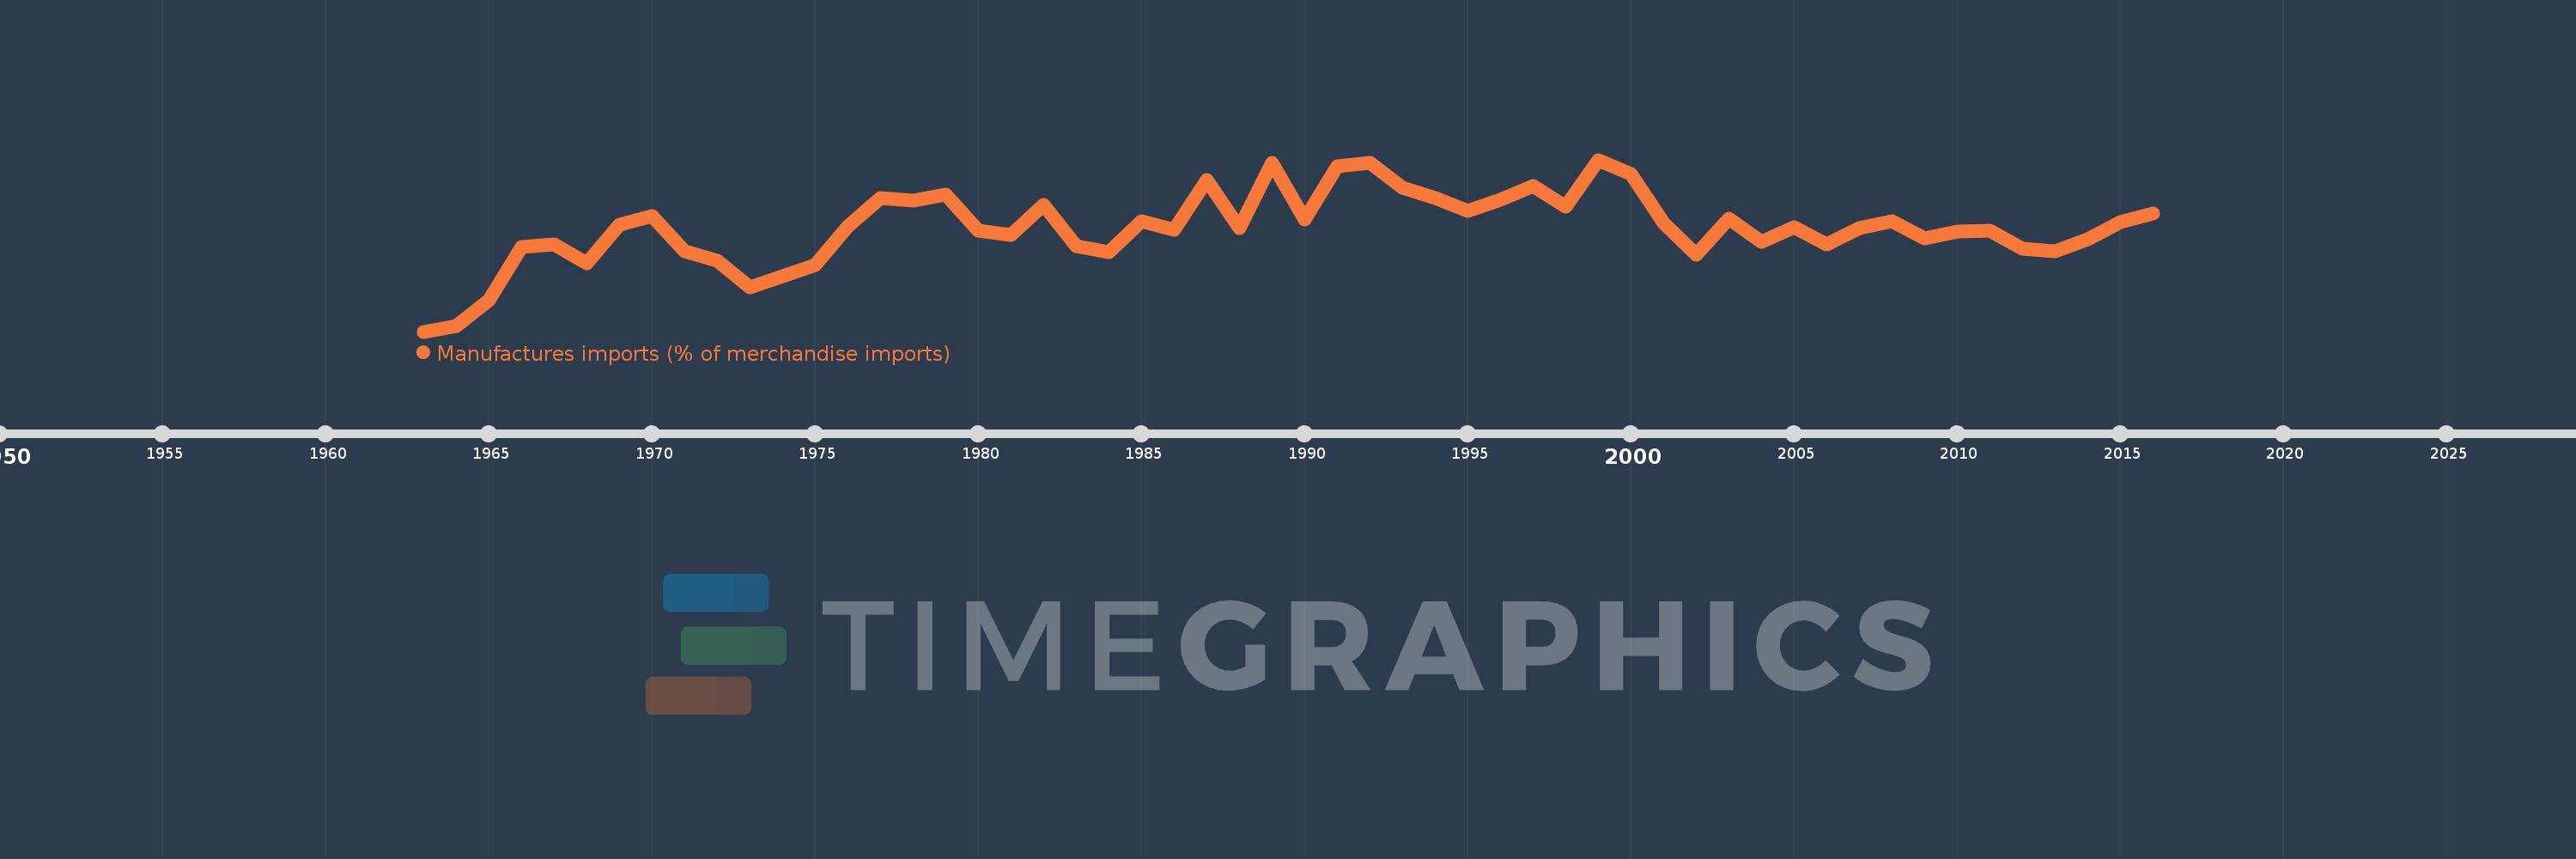
Manufactures imports (% of merchandise imports)
2016,2015,2014,2013,2012,2011,2010,2009,2008,2007,2006,2005,2004,2003,2002,2001,2000,1999,1998,1997,1996,1995,1994,1993,1992,1991,1990,1989,1988,1987,1986,1985,1984,1983,1982,1981,1980,1979,1978,1977,1976,1975,1973,1972,1971,1970,1969,1968,1967,1966,1965,1964,1963
Estas estadísticas en otros países:
AfghanistanAlbaniaAlgeriaAndorraAngolaAntigua and BarbudaArab WorldArgentinaArmeniaArubaAustraliaAustriaAzerbaijanBahamas, TheBahrainBangladeshBarbadosBelarusBelgiumBelizeBeninBermudaBhutanBoliviaBosnia and HerzegovinaBotswanaBrazilBrunei DarussalamBulgariaBurkina FasoBurundiCabo VerdeCambodiaCameroonCanadaCaribbean small statesCayman IslandsCentral African RepublicCentral Europe and the BalticsChadChileChinaColombiaComorosCongo, Dem. Rep.Congo, Rep.Costa RicaCote d'IvoireCroatiaCubaCyprusCzech RepublicDenmarkDjiboutiDominicaDominican RepublicEarly-demographic dividendEast Asia & PacificEast Asia & Pacific (excluding high income)East Asia & Pacific (IDA & IBRD countries)EcuadorEgypt, Arab Rep.El SalvadorEquatorial GuineaEritreaEstoniaEthiopiaEuro areaEurope & Central AsiaEurope & Central Asia (excluding high income)Europe & Central Asia (IDA & IBRD countries)European UnionFaroe IslandsFijiFinlandFragile and conflict affected situationsFranceFrench PolynesiaGabonGambia, TheGeorgiaGermanyGhanaGreeceGreenlandGrenadaGuatemalaGuineaGuinea-BissauGuyanaHaitiHeavily indebted poor countries (HIPC)High incomeHondurasHong Kong SAR, ChinaHungaryIBRD onlyIcelandIDA & IBRD totalIDA blendIDA onlyIDA totalIndiaIndonesiaIran, Islamic Rep.IraqIrelandIsraelItalyJamaicaJapanJordanKazakhstanKenyaKiribatiKorea, Rep.KuwaitKyrgyz RepublicLao PDRLate-demographic dividendLatin America & Caribbean Latin America & Caribbean (excluding high income)Latin America & the Caribbean (IDA & IBRD countries)LatviaLeast developed countries: UN classificationLebanonLesothoLiberiaLibyaLithuaniaLow & middle incomeLow incomeLower middle incomeLuxembourgMacao SAR, ChinaMacedonia, FYRMadagascarMalawiMalaysiaMaldivesMaliMaltaMauritaniaMauritiusMexicoMiddle East & North AfricaMiddle East & North Africa (excluding high income)Middle East & North Africa (IDA & IBRD countries)Middle incomeMoldovaMongoliaMoroccoMozambiqueMyanmarNamibiaNepalNetherlandsNew CaledoniaNew ZealandNicaraguaNigerNigeriaNorth AmericaNorwayOECD membersOmanOther small statesPacific island small statesPakistanPalauPanamaPapua New GuineaParaguayPeruPhilippinesPolandPortugalPost-demographic dividendPre-demographic dividendQatarRomaniaRussian FederationRwandaSamoaSao Tome and PrincipeSaudi ArabiaSenegalSerbiaSeychellesSierra LeoneSingaporeSlovak RepublicSloveniaSmall statesSolomon IslandsSomaliaSouth AfricaSouth AsiaSouth Asia (IDA & IBRD)SpainSri LankaSt. Kitts and NevisSt. LuciaSt. Vincent and the GrenadinesSub-Saharan Africa Sub-Saharan Africa (excluding high income)Sub-Saharan Africa (IDA & IBRD countries)SudanSurinameSwazilandSwedenSwitzerlandSyrian Arab RepublicTajikistanTanzaniaThailandTimor-LesteTogoTongaTrinidad and TobagoTunisiaTurkeyTurkmenistanTurks and Caicos IslandsTuvaluUgandaUkraineUnited Arab EmiratesUnited KingdomUnited StatesUpper middle incomeUruguayVanuatuVenezuela, RBVietnamVirgin Islands (U.S.)WorldYemen, Rep.ZambiaZimbabwe línea de tiempo (timeline):
En esta escala de tiempo se presenta un gráfico de 1963 y 2016 de Bolivia. Los datos de 1962 están ausentes. El número de observaciones reales por fecha: 53.
Fuente (nombre):
Indicadores del desarrollo mundial
Fuente (organización):
World Bank staff estimates from the Comtrade database maintained by the United Nations Statistics Division.
Categorías:
Private Sector, Trade
Se ha actualizado:
23 abr 2017 año
Los indicadores de los cambios de valor en los últimos años
Mínimo:
67.723
1 ene 1963 año
Máximo:
85.652
1 ene 1999 año
A la fecha de observación
Valor
Cambio absoluto
El cambio con respecto al valor anterior
1 ene 1963 año
67.723
+67.723
0.0%
1 ene 1964 año
68.31
+0.588
0.87%
1 ene 1965 año
70.951
+2.641
3.87%
1 ene 1966 año
76.535
+5.583
7.87%
1 ene 1967 año
76.789
+0.254
0.33%
1 ene 1968 año
74.838
-1.951
-2.54%
1 ene 1969 año
78.895
+4.057
5.42%
1 ene 1970 año
79.821
+0.926
1.17%
1 ene 1971 año
76.132
-3.689
-4.62%
1 ene 1972 año
75.085
-1.047
-1.38%
1 ene 1973 año
72.299
-2.787
-3.71%
1 ene 1975 año
74.653
+2.354
3.26%
1 ene 1976 año
78.726
+4.073
5.46%
1 ene 1977 año
81.646
+2.92
3.71%
1 ene 1978 año
81.428
-0.218
-0.27%
1 ene 1979 año
82.026
+0.598
0.73%
1 ene 1980 año
78.258
-3.768
-4.59%
1 ene 1981 año
77.822
-0.436
-0.56%
1 ene 1982 año
80.926
+3.104
3.99%
1 ene 1983 año
76.677
-4.249
-5.25%
1 ene 1984 año
75.986
-0.69
-0.9%
1 ene 1985 año
79.273
+3.286
4.33%
1 ene 1986 año
78.327
-0.946
-1.19%
1 ene 1987 año
83.55
+5.224
6.67%
1 ene 1988 año
78.539
-5.012
-6.0%
1 ene 1989 año
85.37
+6.832
8.7%
1 ene 1990 año
79.377
-5.993
-7.02%
1 ene 1991 año
84.97
+5.593
7.05%
1 ene 1992 año
85.315
+0.345
0.41%
1 ene 1993 año
82.743
-2.573
-3.02%
1 ene 1994 año
81.652
-1.09
-1.32%
1 ene 1995 año
80.302
-1.35
-1.65%
1 ene 1996 año
81.523
+1.221
1.52%
1 ene 1997 año
82.925
+1.402
1.72%
1 ene 1998 año
80.777
-2.148
-2.59%
1 ene 1999 año
85.652
+4.875
6.03%
1 ene 2000 año
84.171
-1.481
-1.73%
1 ene 2001 año
79.094
-5.077
-6.03%
1 ene 2002 año
75.705
-3.389
-4.29%
1 ene 2003 año
79.492
+3.787
5.0%
1 ene 2004 año
77.128
-2.364
-2.97%
1 ene 2005 año
78.633
+1.505
1.95%
1 ene 2006 año
76.835
-1.798
-2.29%
1 ene 2007 año
78.5
+1.665
2.17%
1 ene 2008 año
79.262
+0.762
0.97%
1 ene 2009 año
77.472
-1.79
-2.26%
1 ene 2010 año
78.21
+0.738
0.95%
1 ene 2011 año
78.3
+0.09
0.12%
1 ene 2012 año
76.402
-1.898
-2.42%
1 ene 2013 año
76.087
-0.315
-0.41%
1 ene 2014 año
77.317
+1.23
1.62%
1 ene 2015 año
79.191
+1.874
2.42%
1 ene 2016 año
80.087
+0.896
1.13%
Ranking de los países por los datos estadísticos actuales


Comentarios: