29
/es/
es
AIzaSyAYiBZKx7MnpbEhh9jyipgxe19OcubqV5w
April 1, 2024
167752
Kenya
KEN
true
2
1
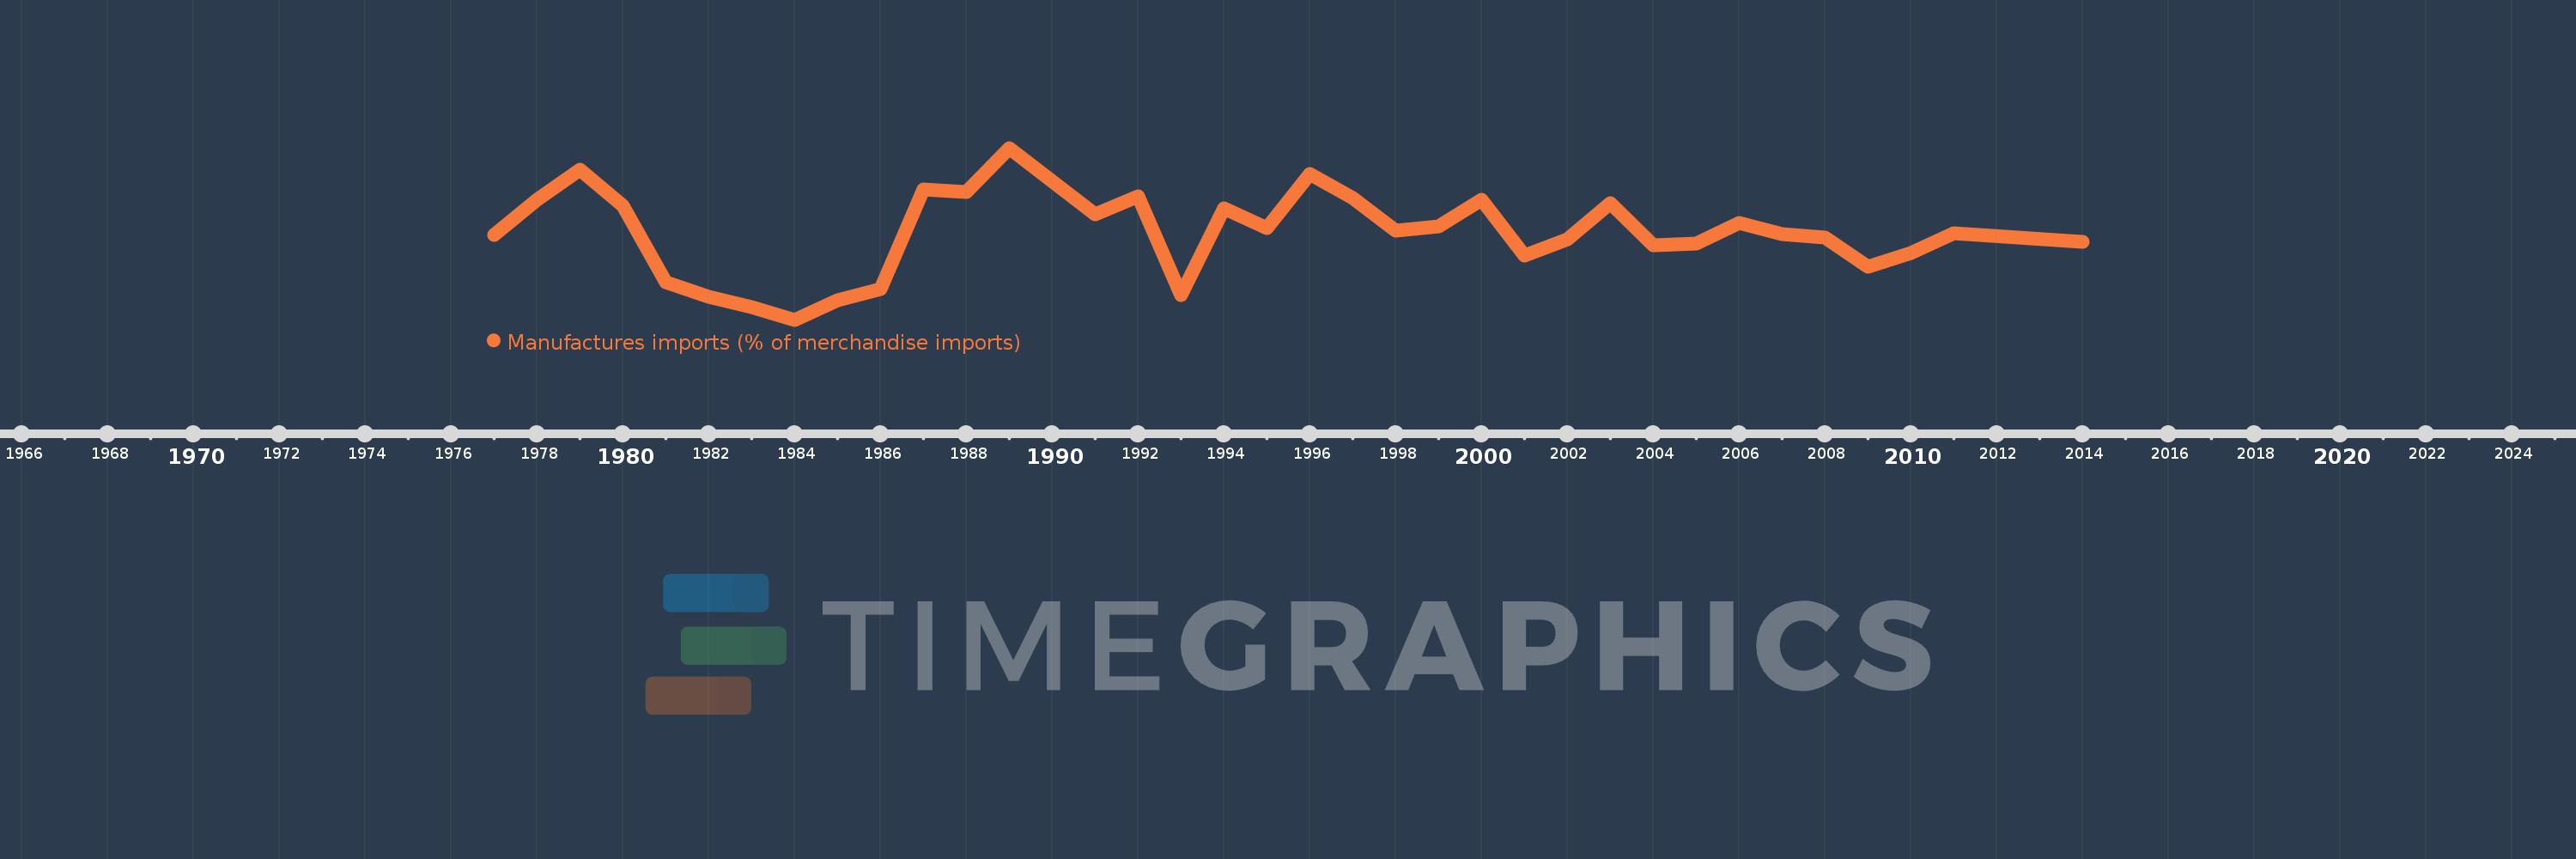
Manufactures imports (% of merchandise imports)
2014,2011,2010,2009,2008,2007,2006,2005,2004,2003,2002,2001,2000,1999,1998,1997,1996,1995,1994,1993,1992,1991,1989,1988,1987,1986,1985,1984,1983,1982,1981,1980,1979,1978,1977
Estas estadísticas en otros países:
AfghanistanAlbaniaAlgeriaAndorraAngolaAntigua and BarbudaArab WorldArgentinaArmeniaArubaAustraliaAustriaAzerbaijanBahamas, TheBahrainBangladeshBarbadosBelarusBelgiumBelizeBeninBermudaBhutanBoliviaBosnia and HerzegovinaBotswanaBrazilBrunei DarussalamBulgariaBurkina FasoBurundiCabo VerdeCambodiaCameroonCanadaCaribbean small statesCayman IslandsCentral African RepublicCentral Europe and the BalticsChadChileChinaColombiaComorosCongo, Dem. Rep.Congo, Rep.Costa RicaCote d'IvoireCroatiaCubaCyprusCzech RepublicDenmarkDjiboutiDominicaDominican RepublicEarly-demographic dividendEast Asia & PacificEast Asia & Pacific (excluding high income)East Asia & Pacific (IDA & IBRD countries)EcuadorEgypt, Arab Rep.El SalvadorEquatorial GuineaEritreaEstoniaEthiopiaEuro areaEurope & Central AsiaEurope & Central Asia (excluding high income)Europe & Central Asia (IDA & IBRD countries)European UnionFaroe IslandsFijiFinlandFragile and conflict affected situationsFranceFrench PolynesiaGabonGambia, TheGeorgiaGermanyGhanaGreeceGreenlandGrenadaGuatemalaGuineaGuinea-BissauGuyanaHaitiHeavily indebted poor countries (HIPC)High incomeHondurasHong Kong SAR, ChinaHungaryIBRD onlyIcelandIDA & IBRD totalIDA blendIDA onlyIDA totalIndiaIndonesiaIran, Islamic Rep.IraqIrelandIsraelItalyJamaicaJapanJordanKazakhstanKenyaKiribatiKorea, Rep.KuwaitKyrgyz RepublicLao PDRLate-demographic dividendLatin America & Caribbean Latin America & Caribbean (excluding high income)Latin America & the Caribbean (IDA & IBRD countries)LatviaLeast developed countries: UN classificationLebanonLesothoLiberiaLibyaLithuaniaLow & middle incomeLow incomeLower middle incomeLuxembourgMacao SAR, ChinaMacedonia, FYRMadagascarMalawiMalaysiaMaldivesMaliMaltaMauritaniaMauritiusMexicoMiddle East & North AfricaMiddle East & North Africa (excluding high income)Middle East & North Africa (IDA & IBRD countries)Middle incomeMoldovaMongoliaMoroccoMozambiqueMyanmarNamibiaNepalNetherlandsNew CaledoniaNew ZealandNicaraguaNigerNigeriaNorth AmericaNorwayOECD membersOmanOther small statesPacific island small statesPakistanPalauPanamaPapua New GuineaParaguayPeruPhilippinesPolandPortugalPost-demographic dividendPre-demographic dividendQatarRomaniaRussian FederationRwandaSamoaSao Tome and PrincipeSaudi ArabiaSenegalSerbiaSeychellesSierra LeoneSingaporeSlovak RepublicSloveniaSmall statesSolomon IslandsSomaliaSouth AfricaSouth AsiaSouth Asia (IDA & IBRD)SpainSri LankaSt. Kitts and NevisSt. LuciaSt. Vincent and the GrenadinesSub-Saharan Africa Sub-Saharan Africa (excluding high income)Sub-Saharan Africa (IDA & IBRD countries)SudanSurinameSwazilandSwedenSwitzerlandSyrian Arab RepublicTajikistanTanzaniaThailandTimor-LesteTogoTongaTrinidad and TobagoTunisiaTurkeyTurkmenistanTurks and Caicos IslandsTuvaluUgandaUkraineUnited Arab EmiratesUnited KingdomUnited StatesUpper middle incomeUruguayVanuatuVenezuela, RBVietnamVirgin Islands (U.S.)WorldYemen, Rep.ZambiaZimbabwe línea de tiempo (timeline):
En esta escala de tiempo se presenta un gráfico de 1977 y 2014 de Kenya. Los datos de 1976 están ausentes. El número de observaciones reales por fecha: 35.
Fuente (nombre):
Indicadores del desarrollo mundial
Fuente (organización):
World Bank staff estimates from the Comtrade database maintained by the United Nations Statistics Division.
Categorías:
Private Sector, Trade
Se ha actualizado:
23 abr 2017 año
Los indicadores de los cambios de valor en los últimos años
Mínimo:
50.519
1 ene 1984 año
Máximo:
74.874
1 ene 1989 año
A la fecha de observación
Valor
Cambio absoluto
El cambio con respecto al valor anterior
1 ene 1977 año
62.591
+62.591
0.0%
1 ene 1978 año
67.495
+4.904
7.84%
1 ene 1979 año
71.787
+4.292
6.36%
1 ene 1980 año
66.689
-5.098
-7.1%
1 ene 1981 año
55.888
-10.801
-16.2%
1 ene 1982 año
53.831
-2.058
-3.68%
1 ene 1983 año
52.328
-1.503
-2.79%
1 ene 1984 año
50.519
-1.809
-3.46%
1 ene 1985 año
53.305
+2.785
5.51%
1 ene 1986 año
54.908
+1.603
3.01%
1 ene 1987 año
69.017
+14.11
25.7%
1 ene 1988 año
68.587
-0.43
-0.62%
1 ene 1989 año
74.874
+6.286
9.17%
1 ene 1991 año
65.516
-9.357
-12.5%
1 ene 1992 año
67.987
+2.471
3.77%
1 ene 1993 año
54.045
-13.942
-20.51%
1 ene 1994 año
66.357
+12.312
22.78%
1 ene 1995 año
63.572
-2.785
-4.2%
1 ene 1996 año
71.226
+7.654
12.04%
1 ene 1997 año
67.799
-3.427
-4.81%
1 ene 1998 año
63.19
-4.609
-6.8%
1 ene 1999 año
63.706
+0.517
0.82%
1 ene 2000 año
67.493
+3.787
5.94%
1 ene 2001 año
59.576
-7.917
-11.73%
1 ene 2002 año
61.975
+2.398
4.03%
1 ene 2003 año
67.01
+5.035
8.12%
1 ene 2004 año
61.018
-5.991
-8.94%
1 ene 2005 año
61.265
+0.247
0.4%
1 ene 2006 año
64.302
+3.037
4.96%
1 ene 2007 año
62.637
-1.665
-2.59%
1 ene 2008 año
62.151
-0.486
-0.78%
1 ene 2009 año
58.09
-4.062
-6.54%
1 ene 2010 año
60.034
+1.945
3.35%
1 ene 2011 año
62.75
+2.715
4.52%
1 ene 2014 año
61.608
-1.142
-1.82%
Ranking de los países por los datos estadísticos actuales


Comentarios: