29
/es/
es
AIzaSyAYiBZKx7MnpbEhh9jyipgxe19OcubqV5w
April 1, 2024
77371
Bahrain
BHR
true
2
1
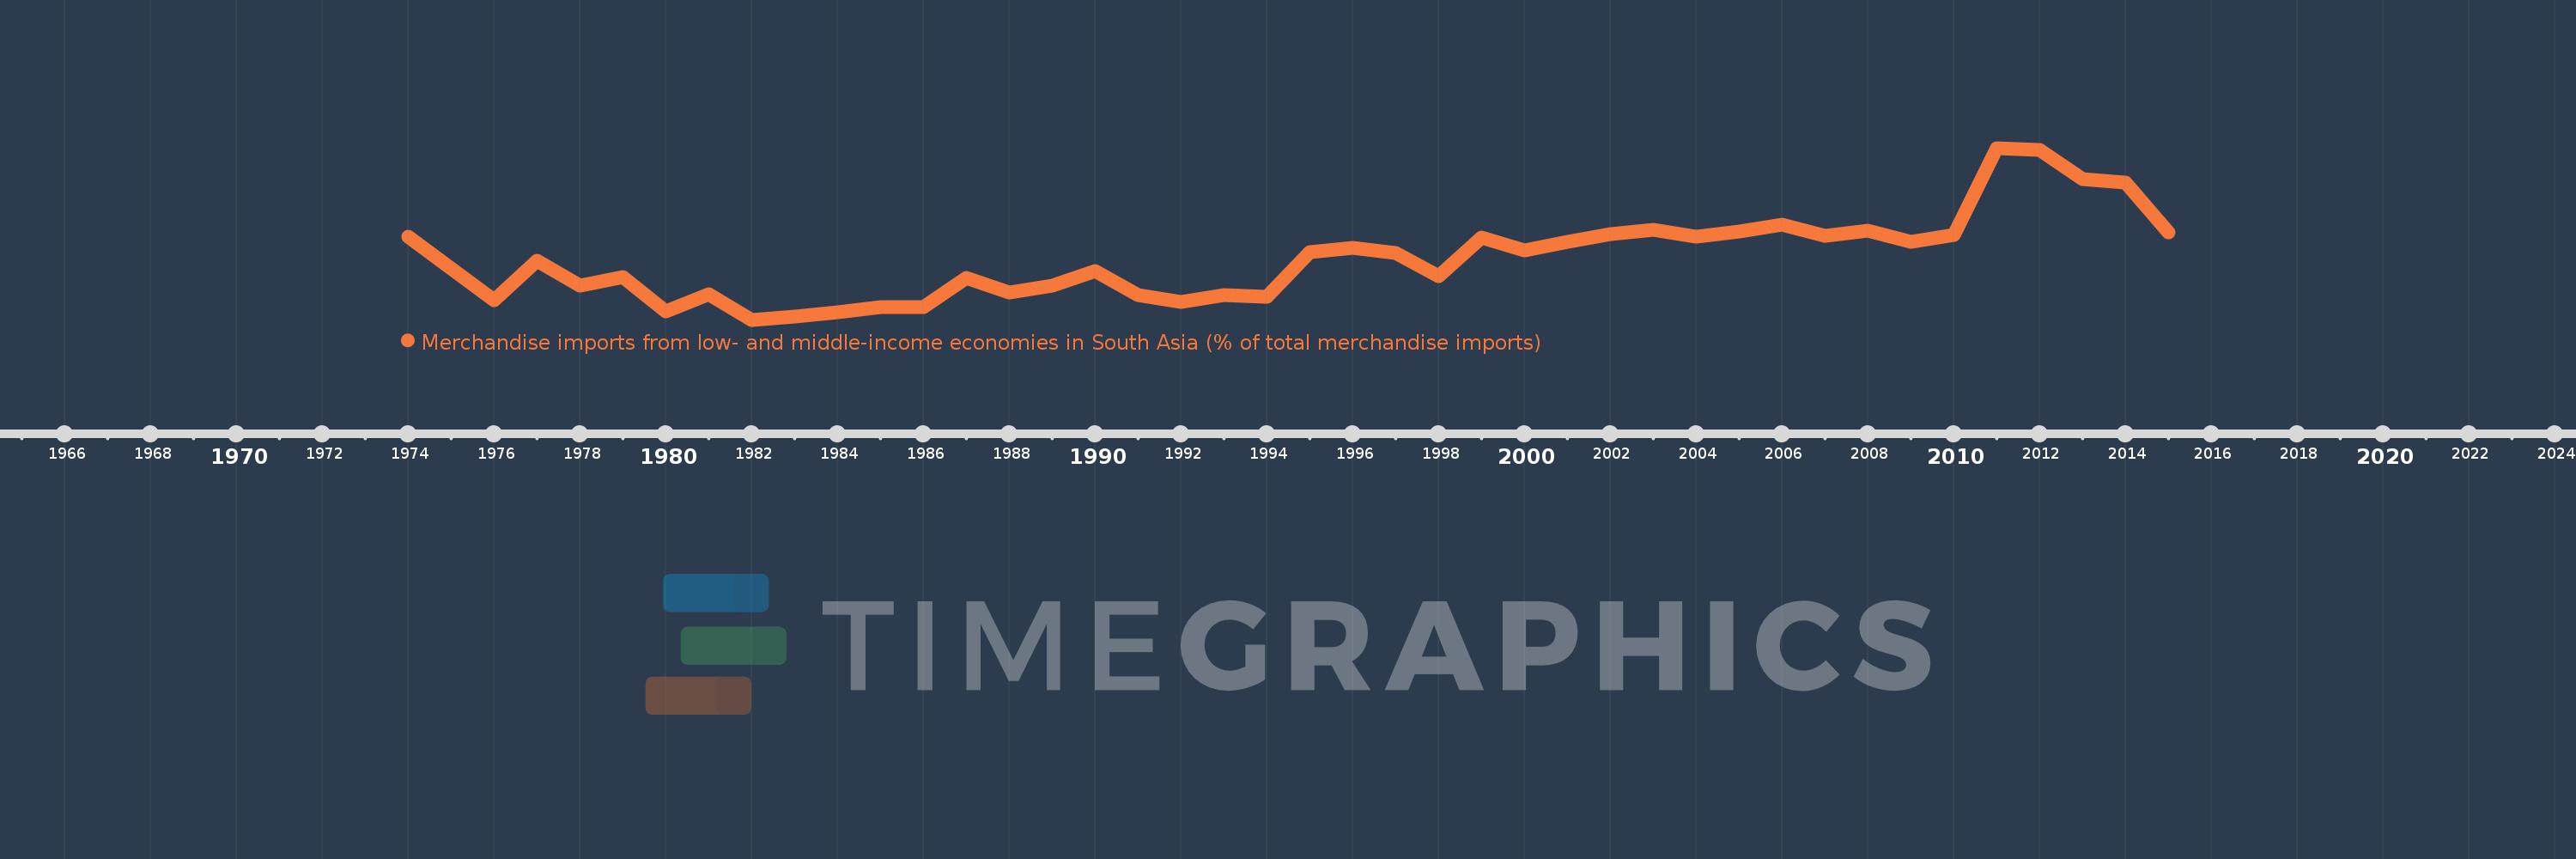
Merchandise imports from low- and middle-income economies in South Asia (% of total merchandise imports)
2015,2014,2013,2012,2011,2010,2009,2008,2007,2006,2005,2004,2003,2002,2001,2000,1999,1998,1997,1996,1995,1994,1993,1992,1991,1990,1989,1988,1987,1986,1985,1984,1983,1982,1981,1980,1979,1978,1977,1976,1975,1974
Estas estadísticas en otros países:
AfghanistanAlbaniaAlgeriaAngolaAntigua and BarbudaArab WorldArgentinaArmeniaArubaAustraliaAustriaAzerbaijanBahamas, TheBahrainBangladeshBarbadosBelarusBelgiumBelizeBeninBermudaBoliviaBrazilBrunei DarussalamBulgariaBurkina FasoBurundiCabo VerdeCambodiaCameroonCanadaCaribbean small statesCentral African RepublicCentral Europe and the BalticsChadChileChinaColombiaCongo, Dem. Rep.Congo, Rep.Costa RicaCote d'IvoireCroatiaCubaCyprusCzech RepublicDenmarkDjiboutiDominicaDominican RepublicEarly-demographic dividendEast Asia & PacificEast Asia & Pacific (excluding high income)East Asia & Pacific (IDA & IBRD countries)EcuadorEgypt, Arab Rep.El SalvadorEstoniaEthiopiaEuro areaEurope & Central AsiaEurope & Central Asia (excluding high income)Europe & Central Asia (IDA & IBRD countries)European UnionFaroe IslandsFijiFinlandFragile and conflict affected situationsFranceGabonGambia, TheGeorgiaGermanyGhanaGibraltarGreeceGreenlandGrenadaGuatemalaGuineaGuyanaHaitiHeavily indebted poor countries (HIPC)High incomeHondurasHong Kong SAR, ChinaHungaryIBRD onlyIcelandIDA & IBRD totalIDA blendIDA onlyIDA totalIndiaIndonesiaIran, Islamic Rep.IraqIrelandIsraelItalyJamaicaJapanJordanKazakhstanKenyaKiribatiKorea, Dem. People’s Rep.Korea, Rep.KosovoKuwaitKyrgyz RepublicLao PDRLate-demographic dividendLatin America & Caribbean Latin America & Caribbean (excluding high income)Latin America & the Caribbean (IDA & IBRD countries)LatviaLeast developed countries: UN classificationLebanonLiberiaLibyaLithuaniaLow & middle incomeLow incomeLower middle incomeLuxembourgMacao SAR, ChinaMacedonia, FYRMadagascarMalawiMalaysiaMaldivesMaliMaltaMauritaniaMauritiusMexicoMiddle East & North AfricaMiddle East & North Africa (excluding high income)Middle East & North Africa (IDA & IBRD countries)Middle incomeMoldovaMongoliaMontenegroMoroccoMozambiqueMyanmarNauruNepalNetherlandsNew CaledoniaNew ZealandNicaraguaNigerNigeriaNorth AmericaNorwayOECD membersOmanOther small statesPacific island small statesPakistanPanamaPapua New GuineaParaguayPeruPhilippinesPolandPortugalPost-demographic dividendPre-demographic dividendQatarRomaniaRussian FederationRwandaSamoaSaudi ArabiaSenegalSerbiaSeychellesSierra LeoneSingaporeSlovak RepublicSloveniaSmall statesSolomon IslandsSomaliaSouth AfricaSouth AsiaSouth Asia (IDA & IBRD)SpainSri LankaSt. Kitts and NevisSt. LuciaSt. Vincent and the GrenadinesSub-Saharan Africa Sub-Saharan Africa (excluding high income)Sub-Saharan Africa (IDA & IBRD countries)SudanSurinameSwedenSwitzerlandSyrian Arab RepublicTajikistanTanzaniaThailandTogoTongaTrinidad and TobagoTunisiaTurkeyTurkmenistanUgandaUkraineUnited Arab EmiratesUnited KingdomUnited StatesUpper middle incomeUruguayUzbekistanVanuatuVenezuela, RBVietnamWorldYemen, Rep.ZambiaZimbabwe línea de tiempo (timeline):
En esta escala de tiempo se presenta un gráfico de 1974 y 2015 de Bahrain. Los datos de 1973 están ausentes. El número de observaciones reales por fecha: 42.
Fuente (nombre):
Indicadores del desarrollo mundial
Fuente (organización):
World Bank staff estimates based data from International Monetary Fund's Direction of Trade database.
Categorías:
Private Sector, Trade
Se ha actualizado:
23 abr 2017 año
Los indicadores de los cambios de valor en los últimos años
Mínimo:
1.06
1 ene 1982 año
Máximo:
6.683
1 ene 2011 año
A la fecha de observación
Valor
Cambio absoluto
El cambio con respecto al valor anterior
1 ene 1974 año
3.765
+3.765
0.0%
1 ene 1975 año
2.748
-1.017
-27.01%
1 ene 1976 año
1.705
-1.043
-37.94%
1 ene 1977 año
2.981
+1.276
74.81%
1 ene 1978 año
2.164
-0.818
-27.42%
1 ene 1979 año
2.444
+0.281
12.97%
1 ene 1980 año
1.333
-1.112
-45.47%
1 ene 1981 año
1.881
+0.548
41.11%
1 ene 1982 año
1.06
-0.82
-43.62%
1 ene 1983 año
1.154
+0.094
8.84%
1 ene 1984 año
1.318
+0.164
14.18%
1 ene 1985 año
1.46
+0.142
10.8%
1 ene 1986 año
1.46
+0.0
0.0%
1 ene 1987 año
2.42
+0.96
65.74%
1 ene 1988 año
1.956
-0.464
-19.16%
1 ene 1989 año
2.184
+0.228
11.63%
1 ene 1990 año
2.654
+0.47
21.53%
1 ene 1991 año
1.879
-0.775
-29.21%
1 ene 1992 año
1.653
-0.225
-12.0%
1 ene 1993 año
1.868
+0.214
12.96%
1 ene 1994 año
1.823
-0.045
-2.42%
1 ene 1995 año
3.259
+1.436
78.8%
1 ene 1996 año
3.408
+0.149
4.58%
1 ene 1997 año
3.236
-0.172
-5.04%
1 ene 1998 año
2.486
-0.75
-23.19%
1 ene 1999 año
3.764
+1.278
51.43%
1 ene 2000 año
3.342
-0.422
-11.22%
1 ene 2001 año
3.616
+0.274
8.19%
1 ene 2002 año
3.877
+0.261
7.22%
1 ene 2003 año
4.017
+0.141
3.62%
1 ene 2004 año
3.774
-0.243
-6.06%
1 ene 2005 año
3.959
+0.185
4.9%
1 ene 2006 año
4.16
+0.201
5.07%
1 ene 2007 año
3.795
-0.365
-8.78%
1 ene 2008 año
3.975
+0.18
4.74%
1 ene 2009 año
3.612
-0.362
-9.11%
1 ene 2010 año
3.84
+0.228
6.31%
1 ene 2011 año
6.683
+2.842
74.01%
1 ene 2012 año
6.612
-0.071
-1.06%
1 ene 2013 año
5.662
-0.95
-14.37%
1 ene 2014 año
5.562
-0.099
-1.75%
1 ene 2015 año
3.916
-1.647
-29.6%
Ranking de los países por los datos estadísticos actuales


Comentarios: