29
/es/
es
AIzaSyAYiBZKx7MnpbEhh9jyipgxe19OcubqV5w
April 1, 2024
53589
Other small states
OSS
false
2
1
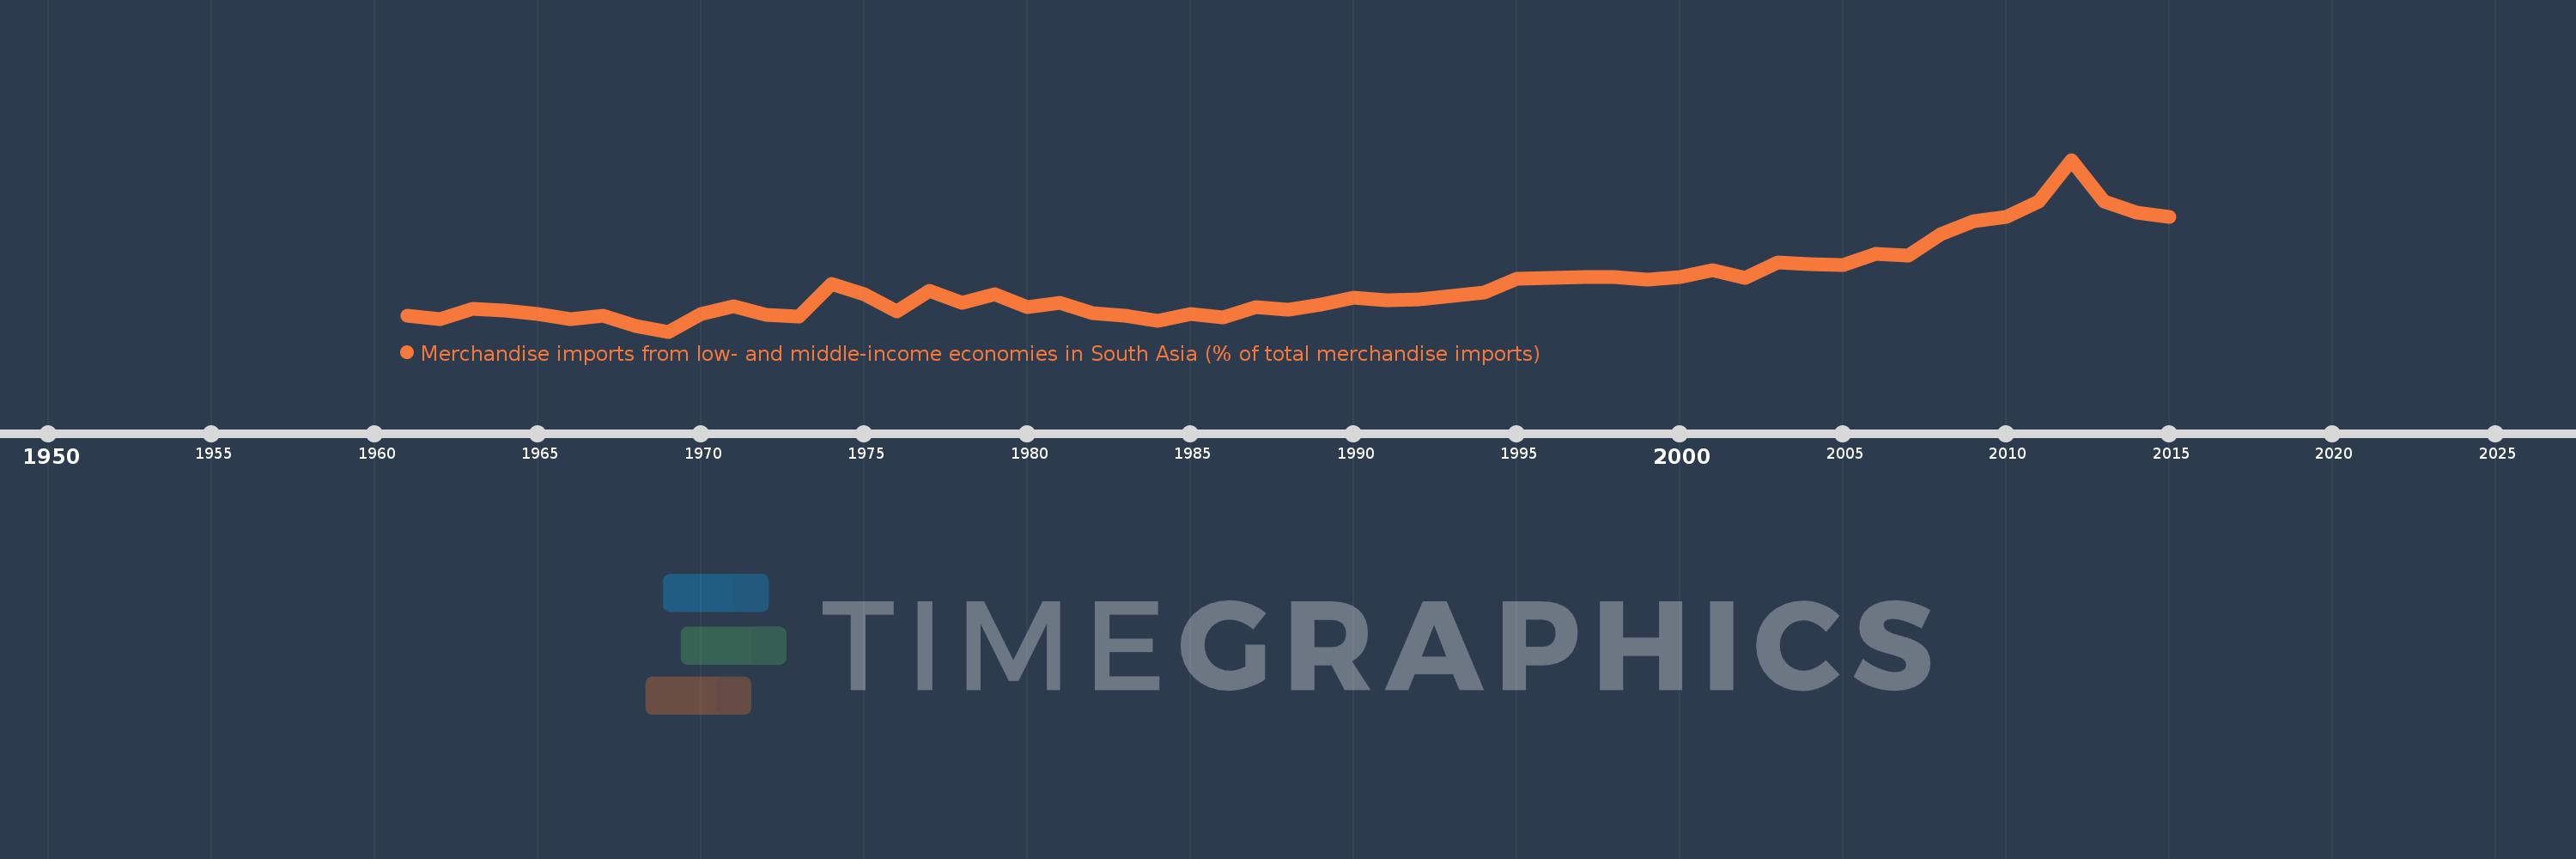
Merchandise imports from low- and middle-income economies in South Asia (% of total merchandise imports)
2015,2014,2013,2012,2011,2010,2009,2008,2007,2006,2005,2004,2003,2002,2001,2000,1999,1998,1997,1996,1995,1994,1993,1992,1991,1990,1989,1988,1987,1986,1985,1984,1983,1982,1981,1980,1979,1978,1977,1976,1975,1974,1973,1972,1971,1970,1969,1968,1967,1966,1965,1964,1963,1962,1961
Estas estadísticas en otros países:
AfghanistanAlbaniaAlgeriaAngolaAntigua and BarbudaArab WorldArgentinaArmeniaArubaAustraliaAustriaAzerbaijanBahamas, TheBahrainBangladeshBarbadosBelarusBelgiumBelizeBeninBermudaBoliviaBrazilBrunei DarussalamBulgariaBurkina FasoBurundiCabo VerdeCambodiaCameroonCanadaCaribbean small statesCentral African RepublicCentral Europe and the BalticsChadChileChinaColombiaCongo, Dem. Rep.Congo, Rep.Costa RicaCote d'IvoireCroatiaCubaCyprusCzech RepublicDenmarkDjiboutiDominicaDominican RepublicEarly-demographic dividendEast Asia & PacificEast Asia & Pacific (excluding high income)East Asia & Pacific (IDA & IBRD countries)EcuadorEgypt, Arab Rep.El SalvadorEstoniaEthiopiaEuro areaEurope & Central AsiaEurope & Central Asia (excluding high income)Europe & Central Asia (IDA & IBRD countries)European UnionFaroe IslandsFijiFinlandFragile and conflict affected situationsFranceGabonGambia, TheGeorgiaGermanyGhanaGibraltarGreeceGreenlandGrenadaGuatemalaGuineaGuyanaHaitiHeavily indebted poor countries (HIPC)High incomeHondurasHong Kong SAR, ChinaHungaryIBRD onlyIcelandIDA & IBRD totalIDA blendIDA onlyIDA totalIndiaIndonesiaIran, Islamic Rep.IraqIrelandIsraelItalyJamaicaJapanJordanKazakhstanKenyaKiribatiKorea, Dem. People’s Rep.Korea, Rep.KosovoKuwaitKyrgyz RepublicLao PDRLate-demographic dividendLatin America & Caribbean Latin America & Caribbean (excluding high income)Latin America & the Caribbean (IDA & IBRD countries)LatviaLeast developed countries: UN classificationLebanonLiberiaLibyaLithuaniaLow & middle incomeLow incomeLower middle incomeLuxembourgMacao SAR, ChinaMacedonia, FYRMadagascarMalawiMalaysiaMaldivesMaliMaltaMauritaniaMauritiusMexicoMiddle East & North AfricaMiddle East & North Africa (excluding high income)Middle East & North Africa (IDA & IBRD countries)Middle incomeMoldovaMongoliaMontenegroMoroccoMozambiqueMyanmarNauruNepalNetherlandsNew CaledoniaNew ZealandNicaraguaNigerNigeriaNorth AmericaNorwayOECD membersOmanOther small statesPacific island small statesPakistanPanamaPapua New GuineaParaguayPeruPhilippinesPolandPortugalPost-demographic dividendPre-demographic dividendQatarRomaniaRussian FederationRwandaSamoaSaudi ArabiaSenegalSerbiaSeychellesSierra LeoneSingaporeSlovak RepublicSloveniaSmall statesSolomon IslandsSomaliaSouth AfricaSouth AsiaSouth Asia (IDA & IBRD)SpainSri LankaSt. Kitts and NevisSt. LuciaSt. Vincent and the GrenadinesSub-Saharan Africa Sub-Saharan Africa (excluding high income)Sub-Saharan Africa (IDA & IBRD countries)SudanSurinameSwedenSwitzerlandSyrian Arab RepublicTajikistanTanzaniaThailandTogoTongaTrinidad and TobagoTunisiaTurkeyTurkmenistanUgandaUkraineUnited Arab EmiratesUnited KingdomUnited StatesUpper middle incomeUruguayUzbekistanVanuatuVenezuela, RBVietnamWorldYemen, Rep.ZambiaZimbabwe línea de tiempo (timeline):
En esta escala de tiempo se presenta un gráfico de 1961 y 2015 de Other small states. Los datos de 1960 están ausentes. El número de observaciones reales por fecha: 55.
Fuente (nombre):
Indicadores del desarrollo mundial
Fuente (organización):
World Bank staff estimates based data from International Monetary Fund's Direction of Trade database.
Categorías:
Private Sector, Trade
Se ha actualizado:
23 abr 2017 año
Los indicadores de los cambios de valor en los últimos años
Mínimo:
0.804
1 ene 1969 año
Máximo:
5.373
1 ene 2012 año
A la fecha de observación
Valor
Cambio absoluto
El cambio con respecto al valor anterior
1 ene 1961 año
1.218
+1.218
0.0%
1 ene 1962 año
1.134
-0.083
-6.85%
1 ene 1963 año
1.413
+0.279
24.59%
1 ene 1964 año
1.373
-0.04
-2.85%
1 ene 1965 año
1.271
-0.102
-7.4%
1 ene 1966 año
1.129
-0.142
-11.17%
1 ene 1967 año
1.229
+0.099
8.8%
1 ene 1968 año
0.951
-0.278
-22.62%
1 ene 1969 año
0.804
-0.147
-15.5%
1 ene 1970 año
1.283
+0.479
59.66%
1 ene 1971 año
1.478
+0.195
15.19%
1 ene 1972 año
1.248
-0.23
-15.58%
1 ene 1973 año
1.202
-0.046
-3.69%
1 ene 1974 año
2.069
+0.867
72.18%
1 ene 1975 año
1.799
-0.27
-13.05%
1 ene 1976 año
1.342
-0.456
-25.37%
1 ene 1977 año
1.878
+0.536
39.92%
1 ene 1978 año
1.578
-0.3
-15.97%
1 ene 1979 año
1.806
+0.228
14.44%
1 ene 1980 año
1.463
-0.343
-19.01%
1 ene 1981 año
1.567
+0.104
7.12%
1 ene 1982 año
1.301
-0.266
-16.96%
1 ene 1983 año
1.228
-0.073
-5.64%
1 ene 1984 año
1.091
-0.137
-11.15%
1 ene 1985 año
1.262
+0.171
15.66%
1 ene 1986 año
1.186
-0.076
-6.01%
1 ene 1987 año
1.455
+0.269
22.72%
1 ene 1988 año
1.392
-0.063
-4.36%
1 ene 1989 año
1.535
+0.143
10.29%
1 ene 1990 año
1.707
+0.172
11.23%
1 ene 1991 año
1.647
-0.061
-3.56%
1 ene 1992 año
1.669
+0.023
1.37%
1 ene 1993 año
1.756
+0.087
5.23%
1 ene 1994 año
1.836
+0.079
4.53%
1 ene 1995 año
2.205
+0.37
20.13%
1 ene 1996 año
2.233
+0.028
1.25%
1 ene 1997 año
2.26
+0.027
1.22%
1 ene 1998 año
2.252
-0.008
-0.36%
1 ene 1999 año
2.175
-0.078
-3.45%
1 ene 2000 año
2.255
+0.081
3.71%
1 ene 2001 año
2.434
+0.178
7.91%
1 ene 2002 año
2.239
-0.195
-8.0%
1 ene 2003 año
2.648
+0.409
18.25%
1 ene 2004 año
2.602
-0.046
-1.74%
1 ene 2005 año
2.569
-0.032
-1.24%
1 ene 2006 año
2.865
+0.296
11.5%
1 ene 2007 año
2.832
-0.033
-1.15%
1 ene 2008 año
3.392
+0.56
19.78%
1 ene 2009 año
3.737
+0.345
10.17%
1 ene 2010 año
3.845
+0.107
2.88%
1 ene 2011 año
4.266
+0.422
10.96%
1 ene 2012 año
5.373
+1.107
25.95%
1 ene 2013 año
4.256
-1.118
-20.8%
1 ene 2014 año
3.965
-0.29
-6.83%
1 ene 2015 año
3.859
-0.107
-2.69%
Ranking de los países por los datos estadísticos actuales


Comentarios: