29
/es/
es
AIzaSyAYiBZKx7MnpbEhh9jyipgxe19OcubqV5w
April 1, 2024
215537
Oman
OMN
true
2
1
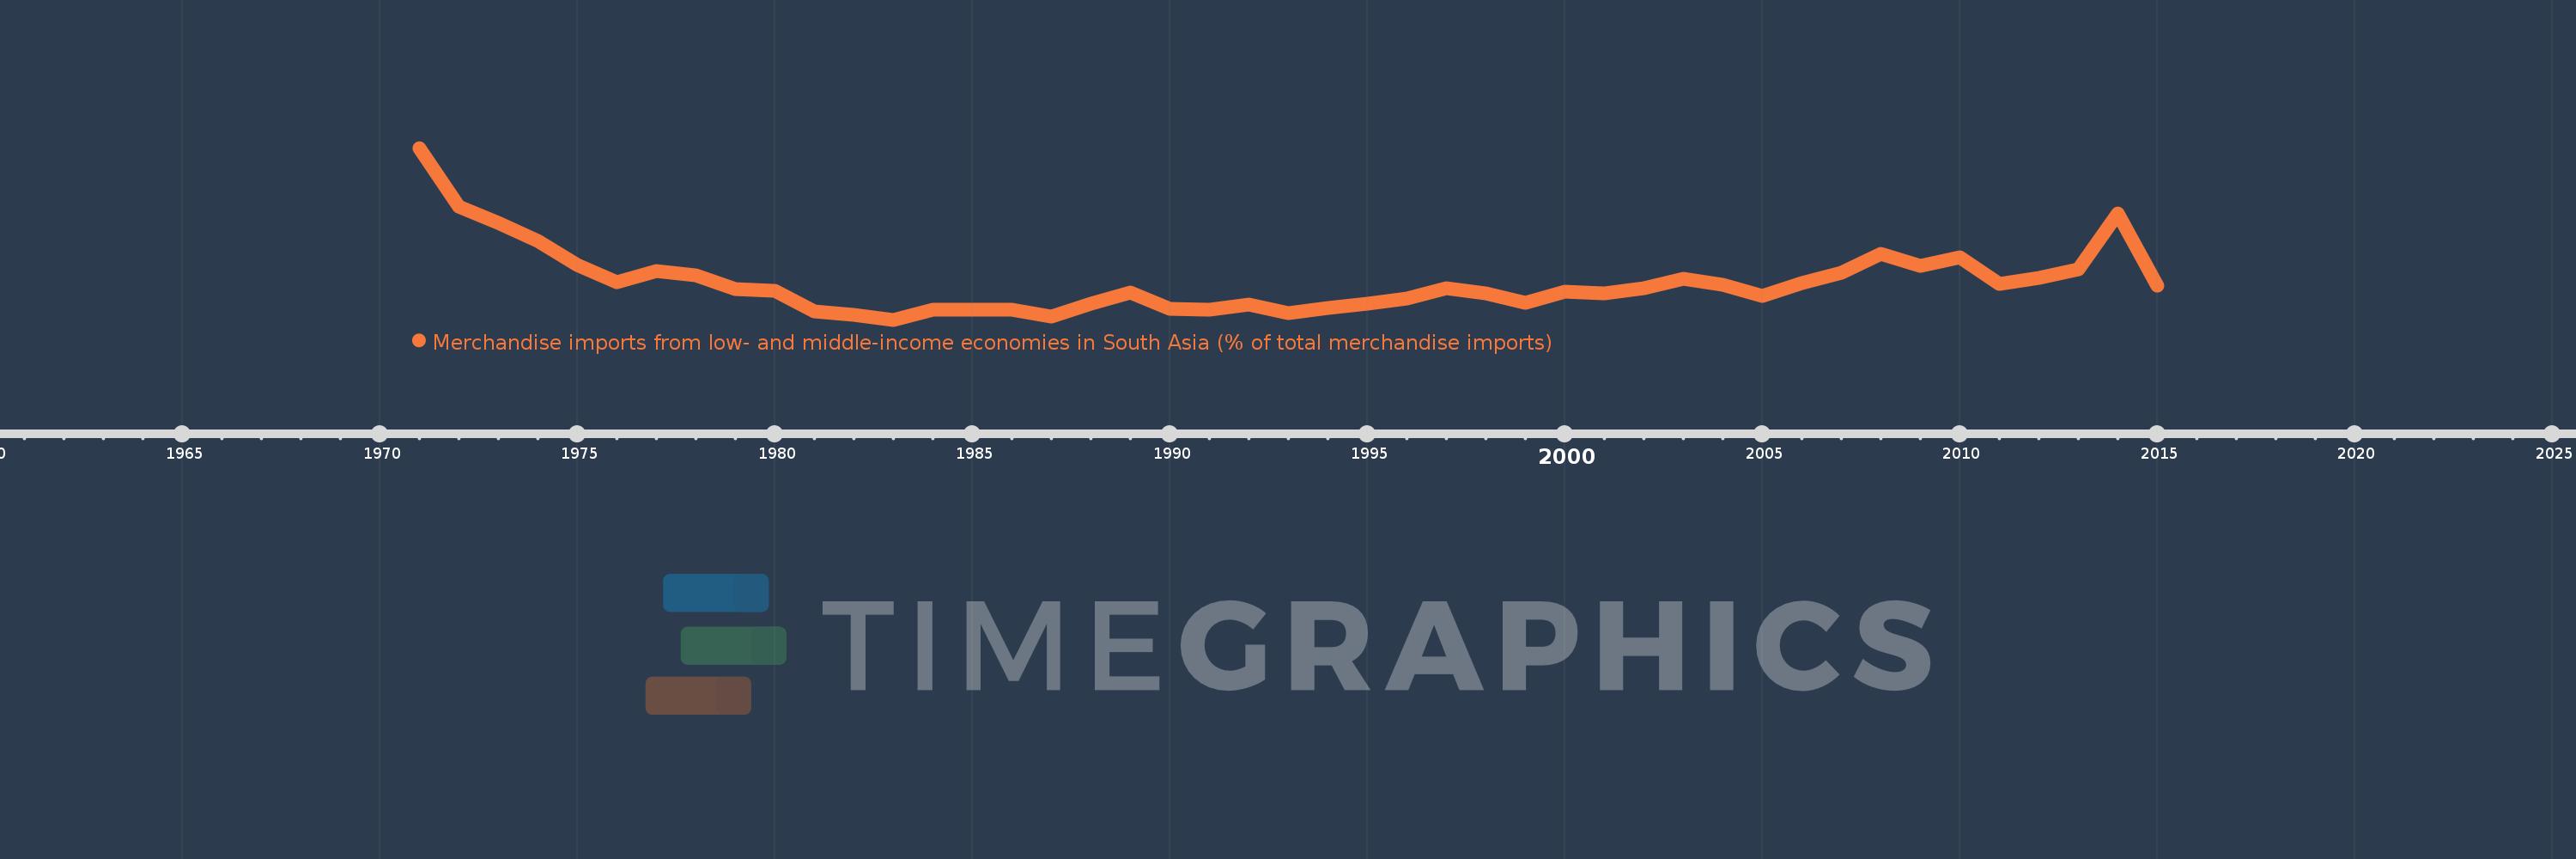
Merchandise imports from low- and middle-income economies in South Asia (% of total merchandise imports)
2015,2014,2013,2012,2011,2010,2009,2008,2007,2006,2005,2004,2003,2002,2001,2000,1999,1998,1997,1996,1995,1994,1993,1992,1991,1990,1989,1988,1987,1986,1985,1984,1983,1982,1981,1980,1979,1978,1977,1976,1975,1974,1973,1972,1971
Estas estadísticas en otros países:
AfghanistanAlbaniaAlgeriaAngolaAntigua and BarbudaArab WorldArgentinaArmeniaArubaAustraliaAustriaAzerbaijanBahamas, TheBahrainBangladeshBarbadosBelarusBelgiumBelizeBeninBermudaBoliviaBrazilBrunei DarussalamBulgariaBurkina FasoBurundiCabo VerdeCambodiaCameroonCanadaCaribbean small statesCentral African RepublicCentral Europe and the BalticsChadChileChinaColombiaCongo, Dem. Rep.Congo, Rep.Costa RicaCote d'IvoireCroatiaCubaCyprusCzech RepublicDenmarkDjiboutiDominicaDominican RepublicEarly-demographic dividendEast Asia & PacificEast Asia & Pacific (excluding high income)East Asia & Pacific (IDA & IBRD countries)EcuadorEgypt, Arab Rep.El SalvadorEstoniaEthiopiaEuro areaEurope & Central AsiaEurope & Central Asia (excluding high income)Europe & Central Asia (IDA & IBRD countries)European UnionFaroe IslandsFijiFinlandFragile and conflict affected situationsFranceGabonGambia, TheGeorgiaGermanyGhanaGibraltarGreeceGreenlandGrenadaGuatemalaGuineaGuyanaHaitiHeavily indebted poor countries (HIPC)High incomeHondurasHong Kong SAR, ChinaHungaryIBRD onlyIcelandIDA & IBRD totalIDA blendIDA onlyIDA totalIndiaIndonesiaIran, Islamic Rep.IraqIrelandIsraelItalyJamaicaJapanJordanKazakhstanKenyaKiribatiKorea, Dem. People’s Rep.Korea, Rep.KosovoKuwaitKyrgyz RepublicLao PDRLate-demographic dividendLatin America & Caribbean Latin America & Caribbean (excluding high income)Latin America & the Caribbean (IDA & IBRD countries)LatviaLeast developed countries: UN classificationLebanonLiberiaLibyaLithuaniaLow & middle incomeLow incomeLower middle incomeLuxembourgMacao SAR, ChinaMacedonia, FYRMadagascarMalawiMalaysiaMaldivesMaliMaltaMauritaniaMauritiusMexicoMiddle East & North AfricaMiddle East & North Africa (excluding high income)Middle East & North Africa (IDA & IBRD countries)Middle incomeMoldovaMongoliaMontenegroMoroccoMozambiqueMyanmarNauruNepalNetherlandsNew CaledoniaNew ZealandNicaraguaNigerNigeriaNorth AmericaNorwayOECD membersOmanOther small statesPacific island small statesPakistanPanamaPapua New GuineaParaguayPeruPhilippinesPolandPortugalPost-demographic dividendPre-demographic dividendQatarRomaniaRussian FederationRwandaSamoaSaudi ArabiaSenegalSerbiaSeychellesSierra LeoneSingaporeSlovak RepublicSloveniaSmall statesSolomon IslandsSomaliaSouth AfricaSouth AsiaSouth Asia (IDA & IBRD)SpainSri LankaSt. Kitts and NevisSt. LuciaSt. Vincent and the GrenadinesSub-Saharan Africa Sub-Saharan Africa (excluding high income)Sub-Saharan Africa (IDA & IBRD countries)SudanSurinameSwedenSwitzerlandSyrian Arab RepublicTajikistanTanzaniaThailandTogoTongaTrinidad and TobagoTunisiaTurkeyTurkmenistanUgandaUkraineUnited Arab EmiratesUnited KingdomUnited StatesUpper middle incomeUruguayUzbekistanVanuatuVenezuela, RBVietnamWorldYemen, Rep.ZambiaZimbabwe línea de tiempo (timeline):
En esta escala de tiempo se presenta un gráfico de 1971 y 2015 de Oman. Los datos de 1970 están ausentes. El número de observaciones reales por fecha: 45.
Fuente (nombre):
Indicadores del desarrollo mundial
Fuente (organización):
World Bank staff estimates based data from International Monetary Fund's Direction of Trade database.
Categorías:
Private Sector, Trade
Se ha actualizado:
23 abr 2017 año
Los indicadores de los cambios de valor en los últimos años
Mínimo:
2.832
1 ene 1983 año
Máximo:
14.262
1 ene 1971 año
A la fecha de observación
Valor
Cambio absoluto
El cambio con respecto al valor anterior
1 ene 1971 año
14.262
+14.262
0.0%
1 ene 1972 año
10.334
-3.928
-27.54%
1 ene 1973 año
9.272
-1.063
-10.28%
1 ene 1974 año
8.083
-1.189
-12.83%
1 ene 1975 año
6.481
-1.602
-19.82%
1 ene 1976 año
5.334
-1.147
-17.69%
1 ene 1977 año
6.063
+0.729
13.66%
1 ene 1978 año
5.806
-0.257
-4.24%
1 ene 1979 año
4.855
-0.952
-16.39%
1 ene 1980 año
4.748
-0.107
-2.2%
1 ene 1981 año
3.367
-1.381
-29.09%
1 ene 1982 año
3.138
-0.229
-6.8%
1 ene 1983 año
2.832
-0.306
-9.76%
1 ene 1984 año
3.5
+0.668
23.6%
1 ene 1985 año
3.487
-0.013
-0.37%
1 ene 1986 año
3.5
+0.012
0.36%
1 ene 1987 año
3.062
-0.438
-12.5%
1 ene 1988 año
3.907
+0.845
27.6%
1 ene 1989 año
4.661
+0.753
19.28%
1 ene 1990 año
3.542
-1.119
-24.01%
1 ene 1991 año
3.516
-0.025
-0.72%
1 ene 1992 año
3.831
+0.315
8.96%
1 ene 1993 año
3.293
-0.538
-14.05%
1 ene 1994 año
3.632
+0.339
10.31%
1 ene 1995 año
3.925
+0.293
8.07%
1 ene 1996 año
4.237
+0.311
7.93%
1 ene 1997 año
4.956
+0.719
16.97%
1 ene 1998 año
4.593
-0.363
-7.32%
1 ene 1999 año
3.936
-0.657
-14.3%
1 ene 2000 año
4.713
+0.778
19.76%
1 ene 2001 año
4.568
-0.145
-3.08%
1 ene 2002 año
4.944
+0.376
8.22%
1 ene 2003 año
5.545
+0.601
12.15%
1 ene 2004 año
5.182
-0.362
-6.53%
1 ene 2005 año
4.442
-0.741
-14.29%
1 ene 2006 año
5.292
+0.851
19.15%
1 ene 2007 año
5.952
+0.66
12.46%
1 ene 2008 año
7.224
+1.272
21.36%
1 ene 2009 año
6.405
-0.819
-11.33%
1 ene 2010 año
6.991
+0.586
9.15%
1 ene 2011 año
5.233
-1.758
-25.15%
1 ene 2012 año
5.606
+0.374
7.14%
1 ene 2013 año
6.182
+0.576
10.27%
1 ene 2014 año
9.878
+3.695
59.77%
1 ene 2015 año
5.128
-4.749
-48.08%
Ranking de los países por los datos estadísticos actuales


Comentarios: